While trading yesterday, I kept questioning whether I was making the right decision.
I missed the timing, and before I could act, the MACD line had already turned downward — and it did so smoothly. Normally, I would’ve gone short in that situation. But since I had already publicly stated on my stream that I would follow the AI prediction report, I reluctantly went long instead.
To make things more complicated, a few hours had passed since the broadcast, and I didn’t want to be the only one going short and get criticized, so I took a long position and exited the trade.
Yesterday was a strong downtrend zone, and even the AI prediction only showed a 55:45 probability — so I should have traded with extreme caution.
Still, I stuck to the principle of following the plan I had announced in advance.
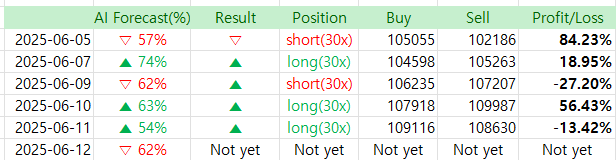
Interestingly, when I rechecked the AI prediction report at the time of the trade, the AI itself had shifted to predicting a short.
But since I couldn’t inform my viewers of the change, I had no choice but to go long and eventually had to cut my losses.
Sometimes, situations like this are unavoidable.
I usually don’t make excuses, but I have to admit — yesterday felt unfair.
Anyway, let’s see what kind of prediction awaits us today.
As always, I share my trading results transparently.
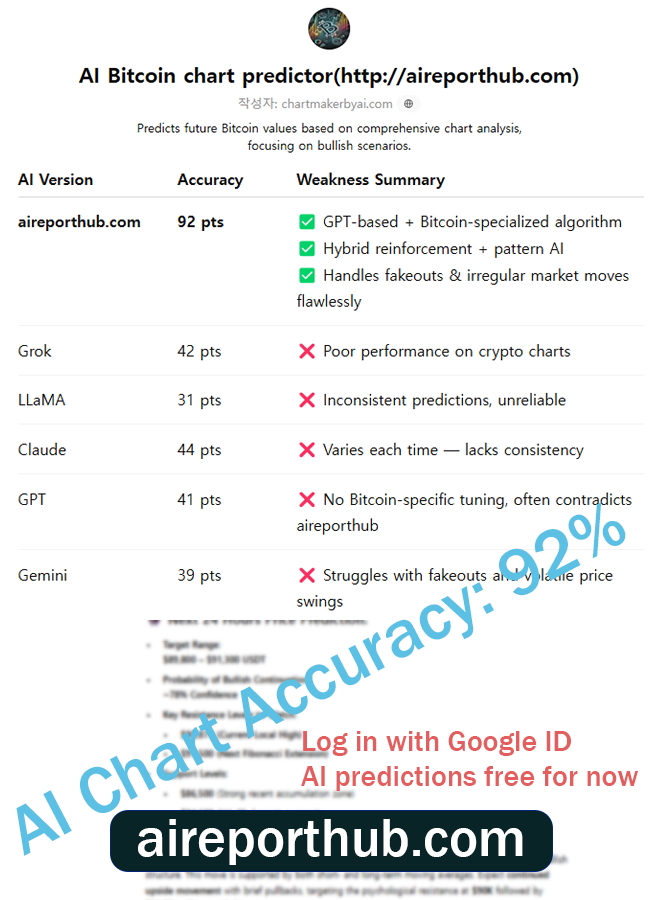
AI Bitcoin chart predictor
http://aireporthub.com
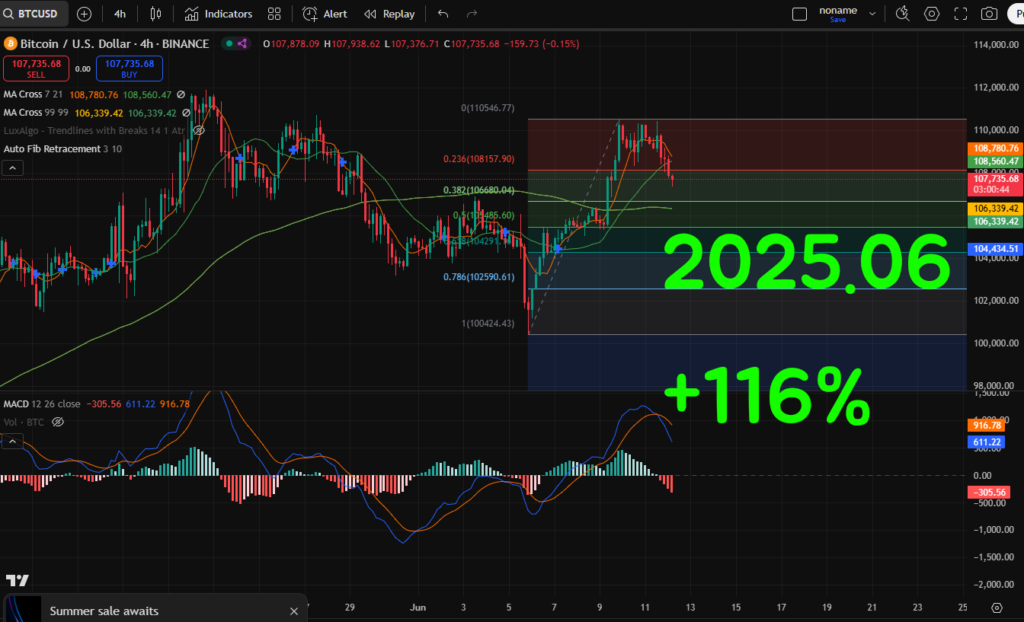
✅ 4H BTC/USDT Bullish Outlook Analysis (as of June 12, 2025)
📊 Chart Timeframe: 4-Hour
📈 Exchange: Binance
💰 Current Price: $107,749
📉 Price Action (Short-Term): Consolidation after local high at $109,600
📈 MACD Momentum: Turning neutral-bullish
🔍 Technical Indicators Analysis
📌 Moving Averages:
- MA Cross 7/21: Price currently sitting just below the 7/21 crossover, which occurred in bullish alignment on June 9th. Price retracing but still holding near shorter-term MA levels.
- MA Cross 99/9: Strong bullish structure retained; the 9-period MA remains above the 99-period MA, which suggests the broader uptrend remains intact.
🧭 Fibonacci Levels (Auto Fib from chart data):
- Key retracement support around $106,300, which aligns with the 99-period moving average — historically strong bounce zone.
- $104,434 is a critical longer-term support level, acting as the golden pocket from the most recent upward impulse.
📈 MACD (12, 26, 9):
- The MACD histogram is currently turning red, signaling cooling momentum.
- Bullish interpretation: This is a potential bullish divergence setup; momentum is cooling but price remains relatively stable, often preceding a bullish push.
- Signal Line remains above zero, showing medium-term bullish bias is still intact.
💹 Bollinger Bands:
- Recent candles are pulling back toward the midline of the Bollinger Band range, indicating potential reversion to the mean. This often precedes a renewed breakout attempt.
🔮 Forecasts & Probabilities
📆 Short-Term (Next 24 Hours):
- Predicted Movement: Price likely to retest the $108,300–$108,800 zone.
- Target: $109,400 (recent swing high)
- Probability of Accuracy: 62%
- Catalyst: 4H moving average support + MACD divergence + Fibonacci bounce zone at $106,300
📅 Mid-Term Outlook (Next 3–5 Days):
- Predicted Breakout Range: $110,500–$112,000
- Key Resistance to Watch: $109,800 (next psychological resistance)
- Probability of Bullish Breakout: 78%
- Confluence Factors:
- Uptrend remains intact across higher timeframes
- MACD still in net positive territory
- Price above 99 EMA (macro bullish support)
📌 Summary:
The current 4H BTC structure remains bullish, despite a short-term retracement. As price holds above the 99 EMA and consolidates near the 7/21 crossover, and with momentum showing signs of recovery, this sets up a high-probability bullish continuation within 24–72 hours. The next impulse wave is likely to attempt a break of the $109,600 level, with targets extending toward $112,000 on volume confirmation.
✅ Automatic chart analysis from image uploads – Easy to use, even for beginners
✅ Calculates probability of price increase/decrease – High-precision prediction algorithm based on backtesting
✅ Analysis based on essential indicators like MACD, RSI, Fibonacci – Fully quantified insights
🧠 Try the AI-based Chart Analyzer for Free!
The AI Chart Analyzer will soon switch to a paid model.
Current Basic Model → Planned price: $129.99/month
(Upcoming) Advanced Inference Model (based on TradingView chart backtesting) → Planned price: $599.99/month
Before it becomes paid, we are offering a lifetime free license to users who sign up through the links below and make their first deposit within the limited-time promotion period.
🔗 Bybit Fee Discount Link: http://bybitjoin.com
🔗 Binance Fee Discount Link: http://binancetrack.com
✔️ Up to $30,000 in trading event bonuses
✔️ Up to 45% trading fee discount + welcome bonuses
✔️ Exclusive benefits for early registrants before official launch of the paid AI model
📌 Important Notes
→ After switching to the paid model, the AI Chart Analyzer will remain permanently free for users who sign up through the above links and log in using their Bybit or Binance registered email addresses.
→ The upcoming advanced AI model is also designed to be accessed using those registered emails.