As of April 29, 2025, Bitcoin is trading at $94,348.49, hovering near a short-term resistance zone following an aggressive upward rally earlier this month. This technical report leverages multiple indicators across different timeframes to assess potential short-term and medium-term price movements.
🔍 Technical Indicators Overview
| Indicator | Value | Interpretation |
|---|---|---|
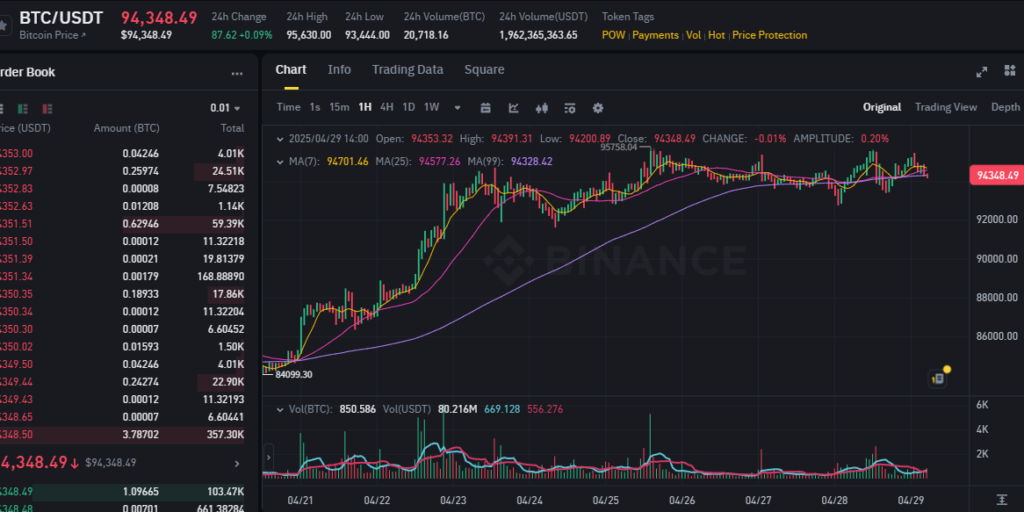
| MA(7) | $94,701 | Slightly over price, mild bearish cross |
| MA(25) | $94,577 | Flatter, short-term consolidation |
| MA(99) | $94,328 | Long-term support still holding |
| RSI (1H) | ~53 | Neutral, no overbought/oversold signal |
| MACD (1H) | Weak bullish crossover | Momentum slowing but still positive |
| Bollinger Bands (1H) | Tightening | Possible volatility spike incoming |
| Volume (recent) | Declining | Suggests reduced interest before major move |
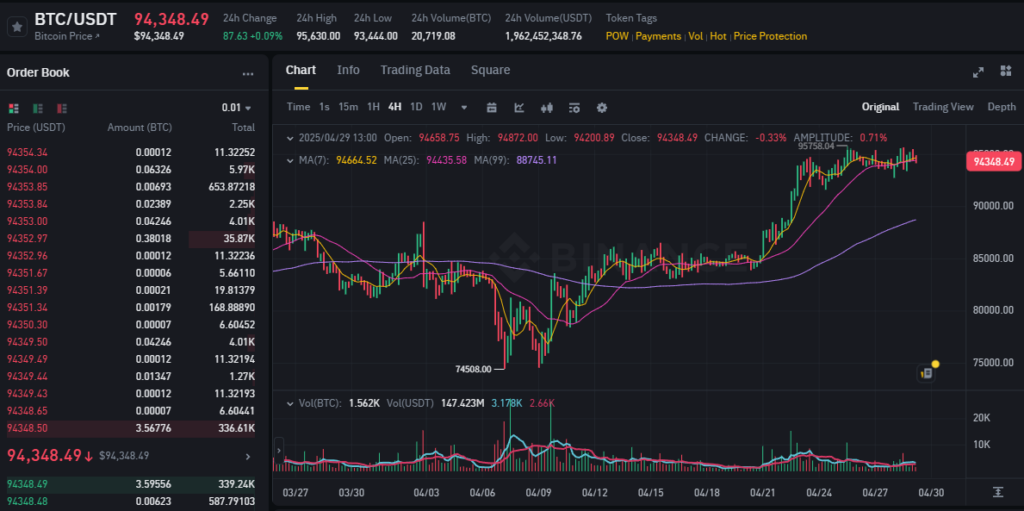
🧭 Chart Context (1H and 4H)
- The 1H chart shows a steady accumulation pattern post-breakout near $84,000 on April 21.
- The price formed a high at $95,758, then began ranging within $92,000–$95,000.
- 4H chart suggests a potential bullish flag, supported by consolidating volume and intact trendlines.
📈 Fibonacci Analysis
From swing low ($74,508) to recent high ($95,758):
- 38.2% retracement: ~$87,377
- 50% retracement: ~$85,133
- 61.8% retracement: ~$82,888
These levels act as support if price revisits lower bands.
🔮 Forecast
| Timeframe | Direction | Target | Confidence |
|---|---|---|---|
| Short-term (12–24h) | Slightly Bullish | $95,800–$97,000 | 70% |
| Mid-term (3–5 days) | Cautiously Bullish | $98,000–$100,500 | 60% |
| Long-term (1–2 weeks) | Bullish Continuation if $95k holds | $105,000+ | 55% |
Risk Note: If BTC breaks below $91,000 with strong volume, the bullish thesis weakens significantly.
Conclusion:
Bitcoin currently shows signs of healthy consolidation following a major upward move. The setup remains cautiously bullish with the next key breakout likely above $95,800. Traders should watch volume closely and prepare for volatility.