In times like these, when Bitcoin (BTC) is fluctuating within a tight consolidation range, accurate technical analysis becomes more essential than ever. Looking at the 4-hour chart, we can clearly identify short-term resistance and support levels. Indicators such as MACD, moving averages (MA), and Fibonacci retracement are also signaling key turning points.
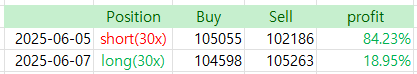
Although I mentioned earlier that I had made two trades in June, I actually placed another secret trade just yesterday. I didn’t livestream it like I usually do — simply because I didn’t have the time to go live, even though the price reached a technical level I had been watching closely.
I opened a short position when BTC touched the 99-period MA on the 4-hour chart and closed it with a satisfying profit. This kind of setup is what I consider a “high-probability, low-risk” trade — practically a must-take opportunity with near-perfect win rates.
Today, once again, I’m reviewing BTC’s price outlook using AI-based chart analysis.


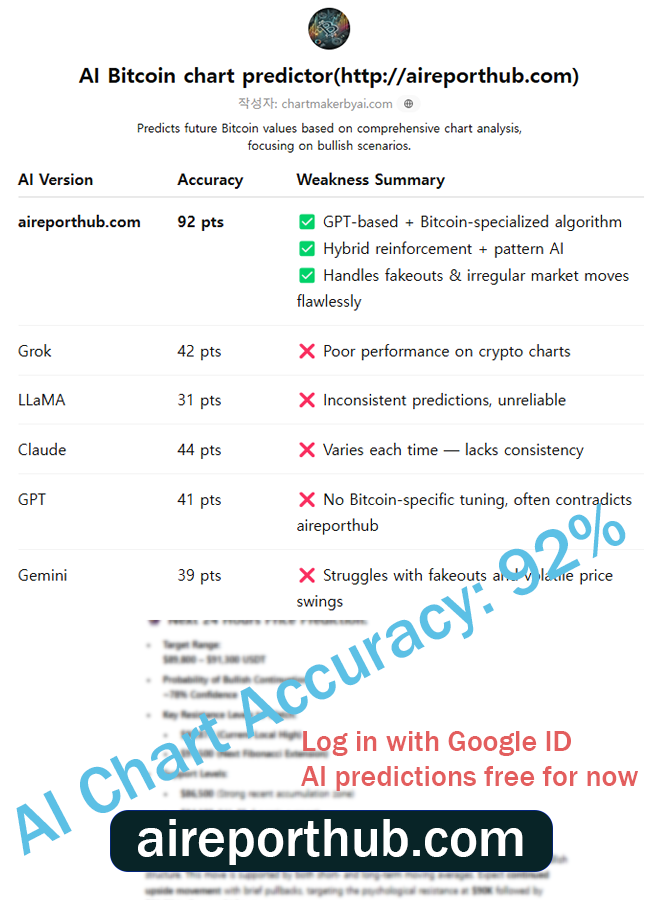
Bitcoin Chart Predictor (http://aicharts.co.kr)
📊 BTC/USD 4-Hour Chart Analysis (Based on BINANCE Data)
At the time of analysis, Bitcoin (BTC) is trading at $105,618. Below is a comprehensive overview based on multiple technical indicators:
🔍 Technical Indicator Overview
1. Moving Averages (MA Cross 7/21 & 99/99)
- Short-Term MA (7/21): $105,803.50 → Currently above the price, acting as immediate resistance
- Medium-to-Long-Term MA (99/99): $106,260.98 → Represents strong resistance
- Price is currently trading between the moving averages, suggesting a potential sideways range or minor correction
2. MACD
- MACD Line (82.86) is above the Signal Line (221.80), signaling a golden cross; however, the lines are converging
- Histogram remains in positive territory but is decreasing, indicating waning bullish momentum
3. Volume
- Trading volume is neutral, but lower compared to the previous upward move, implying weakened buying strength
4. Fibonacci Retracement (Auto Fib)
- From the recent high (~$110,000), BTC is now in a 0.382–0.5 retracement zone, a classic consolidation area
5. LuxAlgo Trendlines
- The chart shows rejection at the upper trendline, with price moving sideways and awaiting directional confirmation
📈 Short-Term Outlook (Next 24 Hours)
- Upside Resistance Levels:
- $105,800 (short-term MA resistance)
- $106,260 (medium-term MA resistance, major level)
- Downside Support Levels:
- $104,928 (short-term support, 21-period MA)
- $104,434 (previous local low and Fib 0.5 level)
- Technical Pattern Assessment:
- With weakening MACD momentum, narrowing MA gap, and decreasing volume, a sideways or slight downward move is more probable
✅ Probability of Downward Movement (within 24h): 62%
✅ Probability of Upward Movement (within 24h): 38%
Expected Price Range: $104,400 – $106,200
📉 Mid-to-Long-Term Outlook (1–2 Weeks)
- Potential for a death cross if the short-term MA crosses below the long-term MA
- Consolidation around the $105,000 level will determine trend direction
- If BTC successfully breaks and holds above $106,500, we may see a retest of the $112,000 zone
- However, if the breakout fails, a further correction toward the $101,800–$102,500 range is likely
✅ Probability of Bearish Trend (1–2 weeks): 58%
✅ Probability of Bullish Breakout (1–2 weeks): 42%
🧠 Overall Assessment
BTC is currently facing strong mid-term resistance with declining bullish momentum. In the short term, the market is more inclined toward consolidation or a minor pullback. A failure to break above the $105,800–$106,200 resistance zone could trigger deeper correction. However, as long as BTC holds above the strong support at $104,400, a bullish rebound remains possible.
✅ Instant analysis from image uploads – even beginners can use it easily
✅ Probability-based forecasting – powered by high-precision backtesting algorithms
✅ Uses key indicators like MACD, RSI, Fibonacci – data-driven and quantifiable insights
🧠 Experience AI-Powered Chart Analysis – Free Trial Available!
AI chart predictor will soon become a paid service:
Basic Model (Current) → $129.99/month
(Coming Soon) Inference-Based Advanced Model (Backtested via TradingView) → $599.99/month
Before we switch to a paid system, we’re offering lifetime free access to users who sign up at the link below and make their first deposit.
Bybit Fee Discount Link
Binance Fee Discount Link
It seems like we’re looking at bearish signals again today. The chart has formed a clean setup, and it’s currently in a zone where a downward move seems very likely. Interestingly, Bitcoin’s volatility appears to be settling down, making it easier to analyze and plan trades more accurately.
In the past, we used to see frequent liquidation spikes, especially on short positions. But lately, that kind of event has become rare.
That’s why this might be the perfect time to secure some solid profits while the conditions are favorable. 😄
Thanks for reading!