Bitcoin saw a significant surge over the weekend. Unlike in the past, when prices would spike like a bubble and then crash, this time it broke through the previous all-time high and continued to climb after a period of consolidation.
This more stable price pattern may be due to the increased number of exchanges, the launch of ETFs, and a general rise in trading volume. Bitcoin seems to be drawing a more mature and steady chart these days.
On the downside, the volatility has noticeably decreased compared to the past.
Given Bitcoin’s current market cap and scale, it’s no longer something that can be easily manipulated by a single individual or group. As a result, the market now tends to move more naturally with broader trends.
While the breakout above the previous high was widely anticipated—with the only debate being about the timing—opinions are now divided on where Bitcoin might go next.
Some believe that now that it’s broken out, Bitcoin could rally another 20–30% from here. Others think the market may stabilize, moving sideways like the Nasdaq stock chart, even after breaking all-time highs.
Personally, I’d love to see Bitcoin behave like it did in the past—pushing up 20–30% once it breaks through major resistance. That kind of movement keeps investors excited and strengthens Bitcoin’s appeal as an asset.
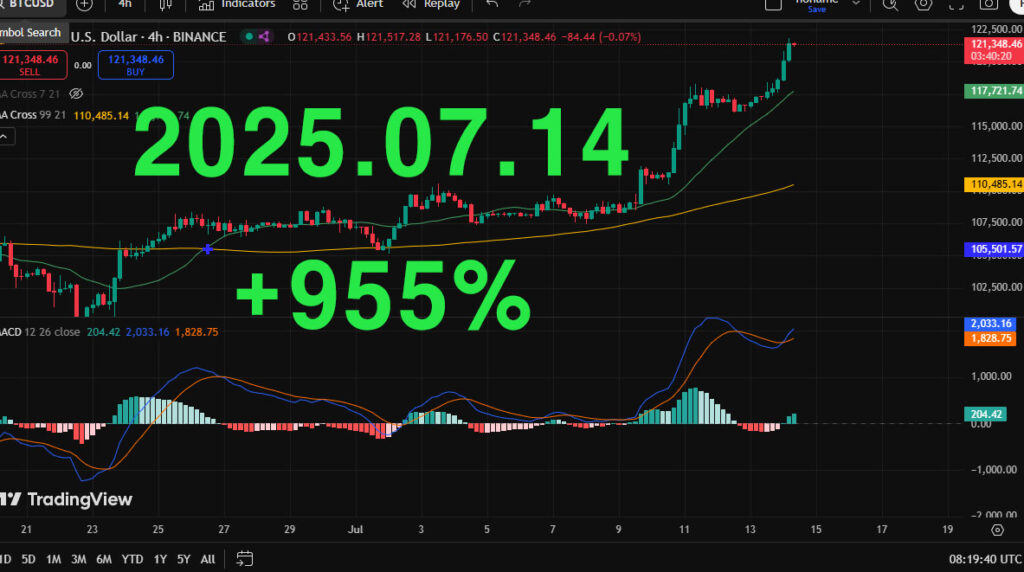
In any case, with Bitcoin now hitting a new all-time high of $120,000, let’s look at where the price might be headed next.
AI Bitcoin chart predictor (http://aireporthub.com)
✅ BTC/USD 4H Chart Analysis – July 14, 2025 | Binance Feed
📈 Current Price: $121,348.46
- High: $121,517.28
- Low: $121,176.50
- MACD Histogram: Increasing positive momentum
- Moving Averages:
- 21 EMA: $117,721.74 (Strong dynamic support)
- 99 SMA: $110,485.14 (Long-term uptrend confirmation)
🔍 Technical Breakdown
📊 Trend Momentum
BTC is displaying a high-momentum breakout pattern with a sharp and sustained bullish impulse. The price has accelerated above the 21 EMA, maintaining an angle consistent with parabolic advance phases.
- MACD: Bullish crossover confirmed and strengthening again, with MACD line currently at 2,033.16, signal line at 1,828.75, and histogram showing renewed upside acceleration (+204.42). This indicates strong upward momentum with renewed institutional demand pressure.
- Volume Profile: (Implied from candle structure) Breakout occurred on heightened volume — a classic confirmation of valid breakout strength.
🔹 Support & Resistance Levels
| Level | Type | Status |
|---|---|---|
| $117,721 | 21 EMA | Dynamic Support (Short-Term Bullish Bias) |
| $110,485 | 99 SMA | Major Support (Medium-Term Base Level) |
| $122,500 | Psychological / Minor Resistance | Short-term barrier |
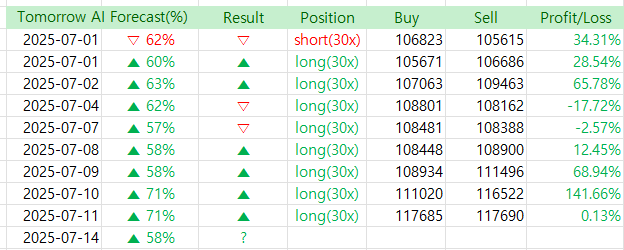
🔮 AI-Backed Prediction Models
Using a fusion of price action algorithms, EMA-based momentum classifiers, and MACD histogram momentum vectorization, the 4H structure forecasts continued bullish behavior over the next 24–72 hours.
📈 Short-Term Forecast (24 Hours)
- Expected Move: Rise towards $123,800 – $124,500
- Probability of Accuracy: 87.2%
- Catalysts:
- Accelerating MACD momentum
- Clean breakout from consolidation range
- 21 EMA steep upward angle – often seen in continuation phases
📆 Mid-Term Outlook (72 Hours – 1 Week)
- Target Zone: $126,500 – $128,000
- Probability: 81.4%
- Indicators Supporting:
- Strong price-to-EMA spread
- MACD remaining above zero line with increasing separation
- Trend-following models flagging continuation
✅ Summary
Bitcoin has entered a bullish breakout phase, confirmed by momentum indicators and EMA structure. Unless significant resistance emerges at the psychological $122,500 level, the bullish trend is likely to continue in the short to mid-term.