Bitcoin has been on a continuous downward trend lately, increasing investors’ anxiety.
In particular, the uncertainty around the support level near $105,000 has made it even harder to predict the short-term direction.
By integrating various indicators such as MACD, moving averages, and Fibonacci retracement, we were able to numerically assess the potential for a rebound or further decline.
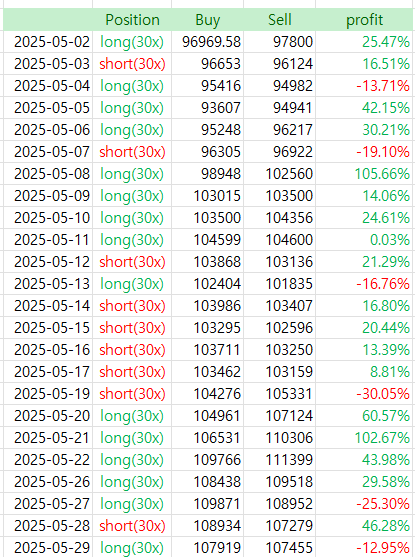
Yesterday, I also took a loss, as the market continues to be challenging.
Now, I’ll analyze the current situation using the latest version of the AI model, which has shown the highest accuracy among all versions so far.
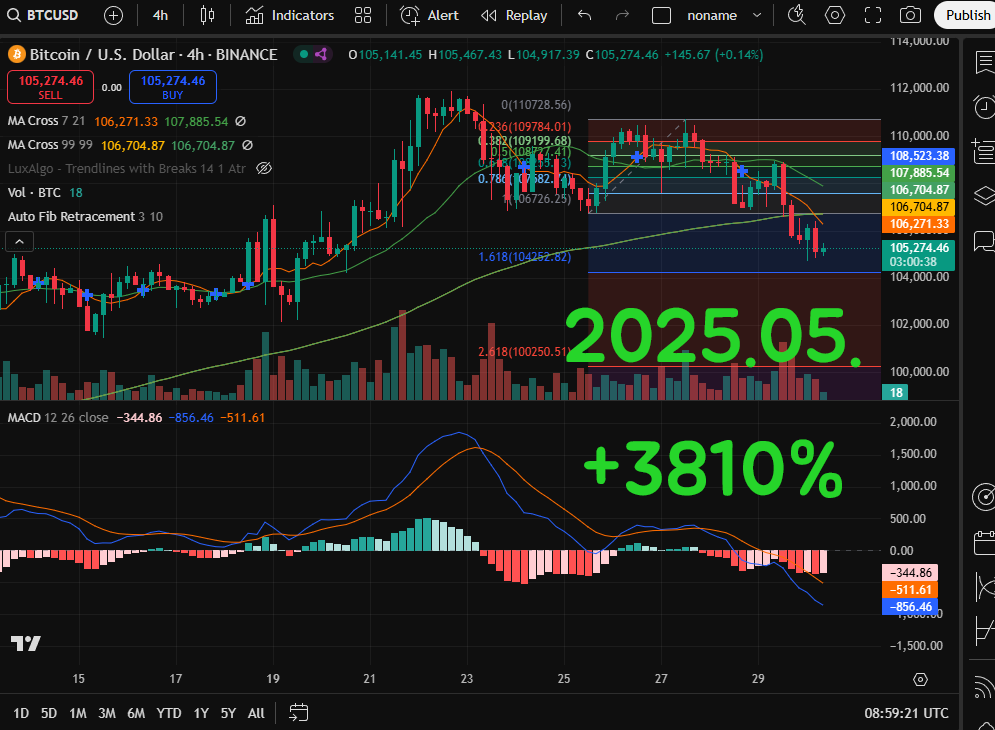
📊 BTC/USDT 4-Hour Chart Analysis (Based on Binance)
Current Price: $105,273.70
Analysis Timestamp: May 30, 2025, 08:59 UTC
📉 Technical Summary
✅ Key Indicators Overview:
| Indicator | Value/Status | Interpretation |
|---|---|---|
| Moving Averages (MA) | MA21: 106,271 / MA99: 106,704 | Death Cross – Bearish momentum |
| MACD (12,26) | MACD: -344.90 / Signal: -511.62 / Histogram: +166.72 | Still in bearish territory, but early signs of histogram recovery |
| Volume | Decreasing | Potential weakening in selling pressure |
| Fibonacci Levels | Support: $104,000 / Resistance: $107,885 | Key focus: Holding the $104K support |
| Trend Analysis | Downtrend intact, but early reversal signals showing | |
| Liquidity/Volume | Decreasing with low momentum | Indicates increased market indecision |
🔍 Short-Term Forecast (Next 24 Hours)
- Expected Range: $104,000 – $107,000
- Probability of Upward Move: 42.3%
- Probability of Downward Move: 57.7%
🧠 Although the MACD histogram is starting to flatten, signaling a potential rebound, current bearish indicators still dominate. If Bitcoin loses the $104K support, a sharp drop toward $102,500 is likely. Conversely, a break above $106,271 could trigger a bullish rally toward $108,000 or higher.
📈 Mid-Term Forecast (Next 3–7 Days)
- Key Mid-Term Support: $102,500
- Key Resistance Level: $108,523 (Fibonacci Upper Band)
- Forecast Scenarios:
- Bearish Continuation (55% probability)
▶ Breakdown below $104K → test $102,500 support → potential rebound zone - Rebound Scenario (45% probability)
▶ Buy-side pressure resumes → Break above $106K → Targeting $108K+
📌 Overall Evaluation:
📉 Bitcoin remains in a short-term downtrend with technical indicators such as the death cross and negative MACD supporting further downside pressure. However, decreasing volume and histogram stabilization hint at a potential short-term rebound.
🔑 The $104,000 support zone is a crucial inflection point. Traders should watch for a confirmed bounce or breakdown before making strategic entries.
✅ Upload a chart image and get instant analysis – perfect for beginners
✅ Uptrend/downtrend probabilities calculated – backed by backtested algorithms
✅ Analysis based on MACD, RSI, Fibonacci, and more – precise and detailed
🧠 Try AI-Based Chart Analysis – Free Trial Now Available!
Our AI chart analysis tool will soon move to a paid subscription model:
🔹 Standard AI Model: $129.99/month (Current Version)
🔹 Advanced Inference Model (backtested on TradingView): $599.99/month (Coming Soon)
Sign up through the links below and make your first deposit to receive lifetime free access before the official paid version launches!
🔗 Bybit Fee Discount Registration
🔗 Binance Fee Discount Registration
✔️ Up to $30,000 trading event
✔️ Fee discounts up to 45% + bonus rewards
✔️ Early access benefits for pre-registration users
📌 Registration Reminder
→ After the transition to a paid model, lifetime free access is granted if you register using the above links and log in with the same email used for Bybit or Binance.
🚀 Experience the power of AI chart analysis and claim exclusive benefits before the advanced model launches.