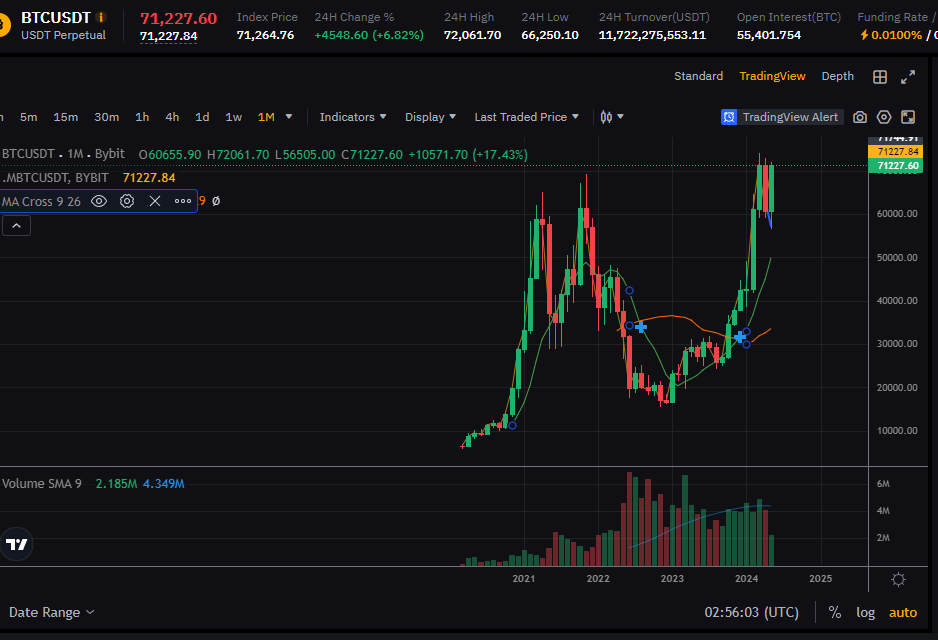
Bitcoin has shown price changes, quickly rising to $71,000, erasing all previous support and resistance lines, and now looking at its previous all-time high.
It has definitely shown a change in direction, and it seems like a time when the momentum might pause, swinging back and forth a bit as it loses some energy.
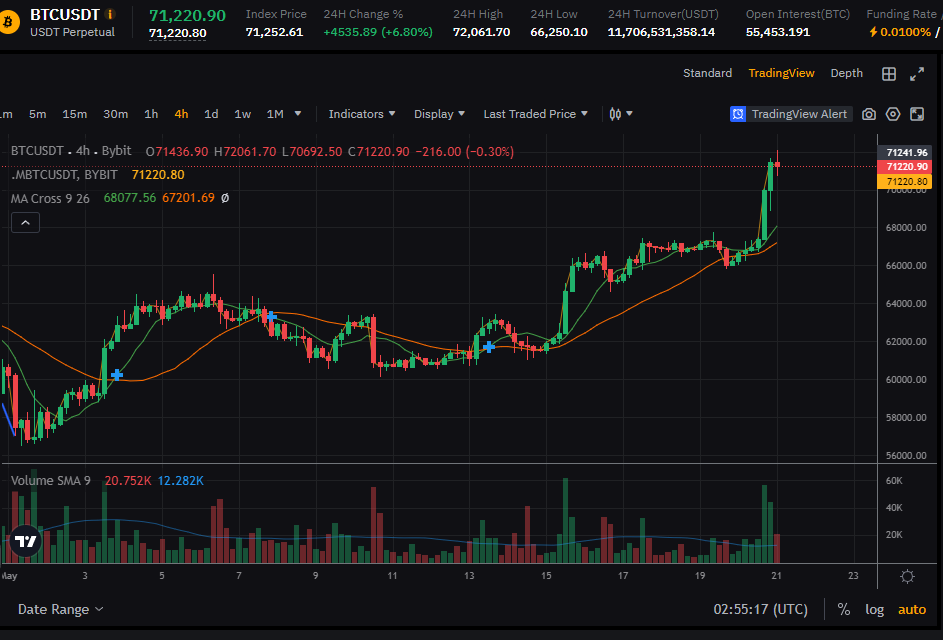
One characteristic of Bitcoin movements is that in sections without clear support and resistance lines, it moves rapidly, giving individuals little chance to buy or sell.
This time, too, the rapid movement did not give people much leisure to purchase or sell Bitcoin.
In the market, the number of people trading Bitcoin is increasing, and along with Bitcoin trading, the trading volume of altcoins also seems to be gradually increasing.

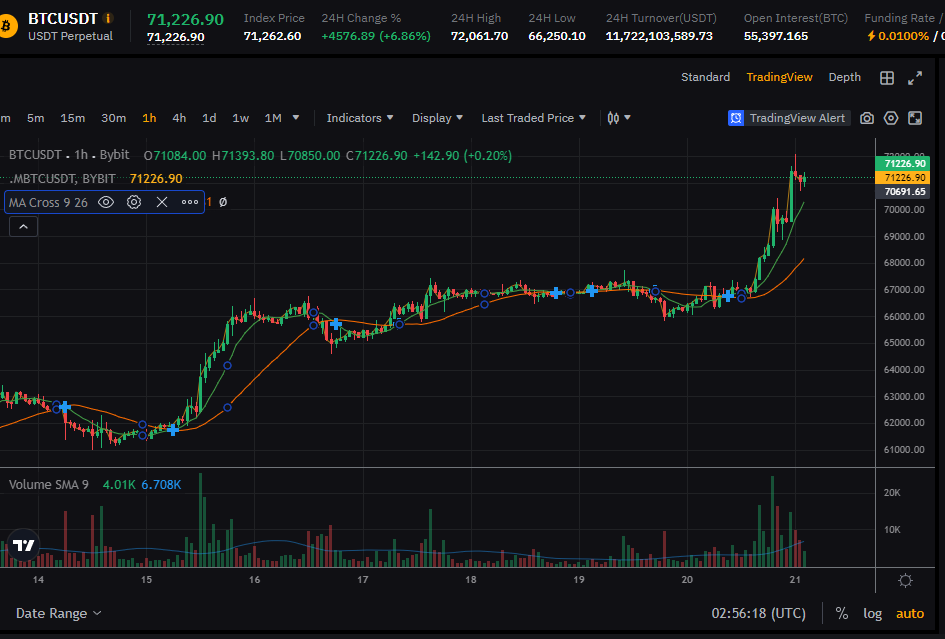
Looking at the movement in 24 hours, it seems likely to fall.
It may be questionable why it would decline when the chart is gaining momentum, but I always think of the Bitcoin chart as a game and try to find patterns within it.
I estimate there is a 60 percent chance it will fall, more like a 6:4 probability.
Although it’s always a matter of probability and can’t always be correct, I tend to place bets when the probability exceeds 60 percent.
I would strongly bet on probabilities of 70 or 80 percent (though an 80 percent probability is very rare), but with over 60 percent, I consider it carefully before betting.
It’s just trusting the power of mathematics; there are no other guesses.
The worst case is when Bitcoin doesn’t show any movement, or the direction it will move isn’t determined with a 5:5 probability. In that case, there’s nothing I can do.
Anyway, I predict that the graph will show a decline in 24 hours.