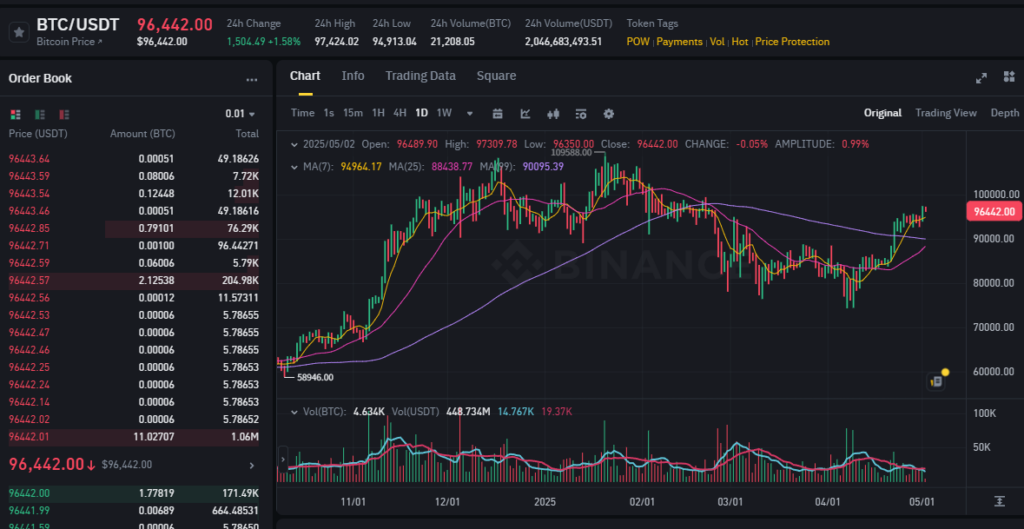
Bitcoin (BTC) has once again validated the accuracy of AI-based forecasting models, with its recent price action aligning precisely with the projected target of $96.5K. As BTC enters a crucial technical zone, a multi-layered analysis of advanced indicators offers insight into potential next moves.
Fibonacci Analysis
BTC is currently consolidating near the 0.786 Fibonacci retracement level (~$96.4K) drawn from the previous all-time high to local bottom. This level often acts as a strong inflection point for either a breakout or a reversal. A clean break above this could open the path to retest the psychological $100K mark, whereas rejection may trigger a corrective wave.
Commodity Channel Index (CCI)
The CCI is reading +185, clearly in the overbought territory. Historically, such levels precede minor pullbacks or consolidation phases. However, during strong bull trends, overbought CCI can persist for extended periods.
Stochastic RSI
The Stochastic RSI shows %K line crossing above the %D line, signaling a potential continuation of upward momentum in the short term. This crossover occurred near the 80 level, a bullish indication under typical conditions, though with limited upside when nearing saturation.
On-Balance Volume (OBV)
The OBV indicator is printing new local highs, confirming that recent price appreciation is supported by volume. This divergence-free price-volume relationship suggests that the current move is structurally sound rather than speculative noise.
MACD & Momentum Outlook
The MACD line remains above the signal line, sustaining a bullish crossover from earlier in the week. The histogram is also expanding positively, indicating increasing bullish momentum. However, the slope is beginning to flatten—traders should monitor for any signs of convergence or a bearish reversal.
Additional Metrics
- Volatility Index (BVOL) has started to tick upward, implying larger intraday swings may soon return.
- Funding rates across major derivatives platforms remain neutral to slightly positive—indicating a balanced sentiment with no excessive leverage.
- Fear & Greed Index sits at 72 (Greed), suggesting some emotional froth in the market.
AI Forecast Accuracy
Notably, the AI model predicted this move toward $96.5K five days ago, using a neural net trained on multi-timeframe technicals and market sentiment data. This continued track record builds confidence in model-guided discretionary trading.
Final Thoughts
While several indicators hint at short-term exhaustion, the broader trend remains bullish. As long as volume sustains and macro liquidity remains supportive, Bitcoin may grind higher with minor corrections. Traders should remain agile, especially as BTC hovers near historically reactive zones.