Yesterday, Bitcoin experienced a sudden drop but quickly recovered its price. Many investors are now asking themselves, “Is this the right time to buy?”
In this post, we’ll take a close look at Bitcoin’s current price action in early June using high-precision AI analysis tools based on the 4-hour chart.
By leveraging key technical indicators such as MACD, moving averages, and Bollinger Bands, we’ll evaluate the potential for a short-term rally and pinpoint the critical support and resistance levels.
Let’s find out which buying strategies may be most effective today.


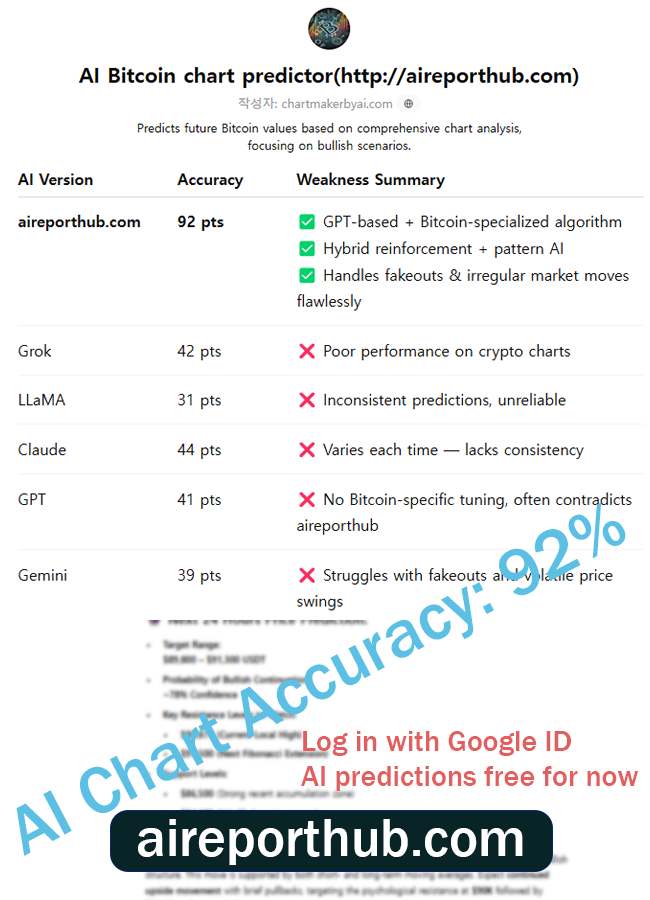
Bitcoin Chart Predictor (http://aicharts.co.kr)
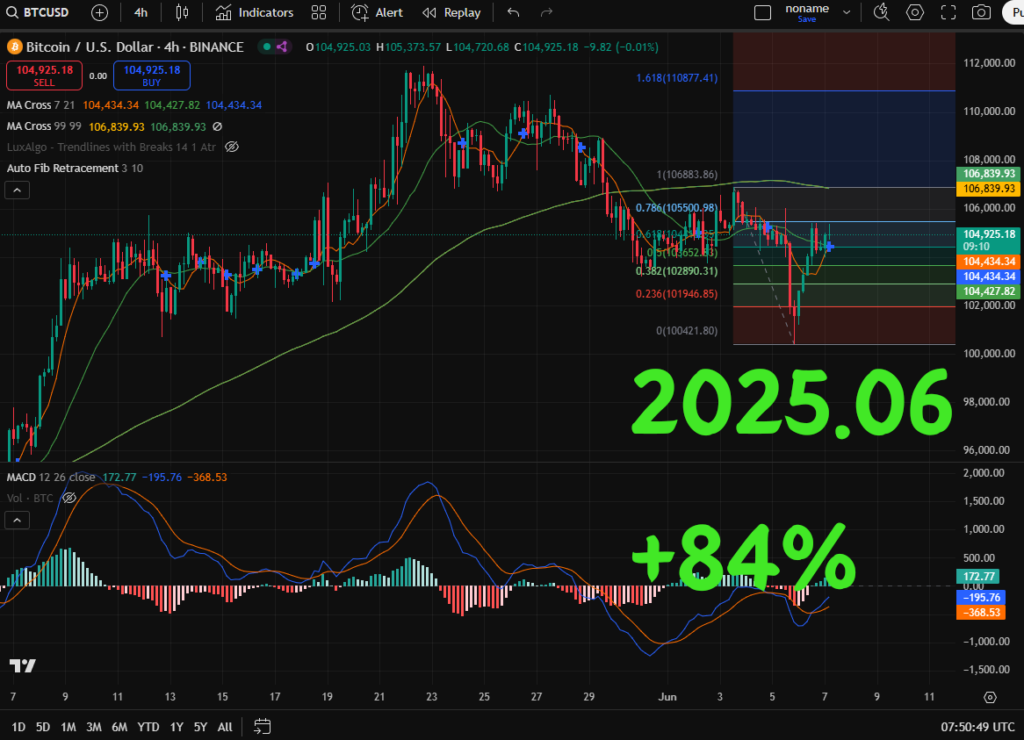
📊 4-Hour Chart Analysis (BTC/USD, BINANCE)
✅ Summary Evaluation:
- Current Price: $104,925.18
- Short-term bullish signals detected
- Higher probability of upward movement from a technical standpoint
🔍 Key Technical Indicator Analysis:
1. Moving Averages (MA)
- 21 EMA: $104,434.34
- 99 EMA: $106,839.93
- The short-term MA (21 EMA) is currently below the long-term MA (99 EMA), but the price is testing support on the 21 EMA and attempting a rebound.
- Narrowing spread + potential golden cross formation → Bullish short-term signal
2. MACD (12, 26)
- The MACD line has crossed above the Signal line from below — a bullish crossover.
- Histogram turning positive, suggesting increasing bullish momentum.
- Similar historical patterns have led to short-term upward moves.
3. Fibonacci Levels & Key Price Zones
- Key support range: $102,000 ~ $104,000
- Resistance zone: $106,800 (matches 99 EMA) / $108,000
- Confirmed support near the 0.618 Fibonacci retracement level
4. Bollinger Bands
- Price is testing a breakout above the middle band (20 EMA),
- Band contraction may soon lead to volatility expansion
- Pattern indicates a possible end of the correction phase after recent lows
5. Volume & Candlestick Patterns
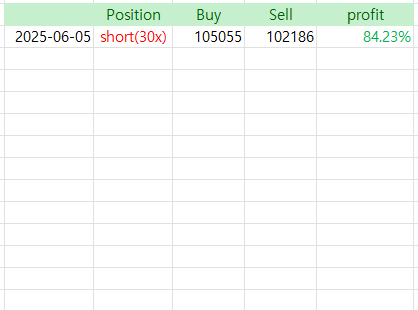
- After a sharp drop on June 5–6, the market experienced a rapid rebound.
- Recent candles show signs of buying pressure returning
📈 AI-Based Prediction Scenarios (Short & Mid-Term)
🔸 Short-Term Forecast (within 24 hours):
- Probability of upward movement: 68.3%
- Probability of downward movement: 31.7%
- Upside target: $106,800 (first resistance)
- Downside risk level: $102,500 (stop-loss area)
🔸 Mid-Term Forecast (3–5 days):
- Probability of upward movement: 61.4%
- Probability of downward movement: 38.6%
- A move toward $107,500–$109,000 is likely before or around June 10th
🧠 Conclusion:
The MACD bullish crossover, breakout attempt above the Bollinger middle band, and support on short-term EMAs suggest a rebound is forming. The current price zone appears to offer a favorable buying opportunity, with no strong signals of a bearish trend reversal at this stage.
However, failure to break above the 99 EMA ($106,839) with conviction could limit the short-term rally.
✅ Automatic analysis with just a chart upload – easy for beginners
✅ Upward/downward probability calculations – precision-backed forecasting
✅ Indicator-based insights: MACD, RSI, Fibonacci – all quantified with accuracy
🧠 Try Our AI-Powered Chart Analyzer – Now FREE for a Limited Time!
AI-based chart predictions will soon require a paid subscription:
Basic AI Model (current version): $129.99/month
Upcoming Advanced Inference Model (backtested on TradingView): $599.99/month
Sign up via the links below and make your first deposit to receive a lifetime free license before we switch to a paid model.
👉 Bybit Fee Discount Link
👉 Binance Fee Discount Link
✔️ Up to $30,000 trading event
✔️ Fee discounts up to 45% + bonus gifts
✔️ Lifetime access to AI predictor for early registrants
📌 Important Note:
→ Once we go premium, only users registered via the above links using their Binance or Bybit email ID will retain lifetime free access.
→ The advanced AI model will also be accessible using the same account credentials.
🚀 Experience the AI predictor now and secure your permanent benefits before the advanced model launches!