Bitcoin (BTC) has recently broken past the critical $100,000 mark, sparking renewed interest among traders and investors around the world. As activity intensifies on major exchanges like Binance and Bybit, the importance of combining traditional technical indicators with advanced AI-based chart analysis tools has never been greater.
In today’s post, we leverage an AI-powered chart analysis tool to examine BTC/USDT on the 4-hour timeframe. Is Bitcoin poised for another rally, or is a correction on the horizon? We’ll break down the current trend using high-precision technical indicators, backtested probabilities, and institutional-grade metrics. This TradingView-based analysis aims to help you make better-informed trading decisions.


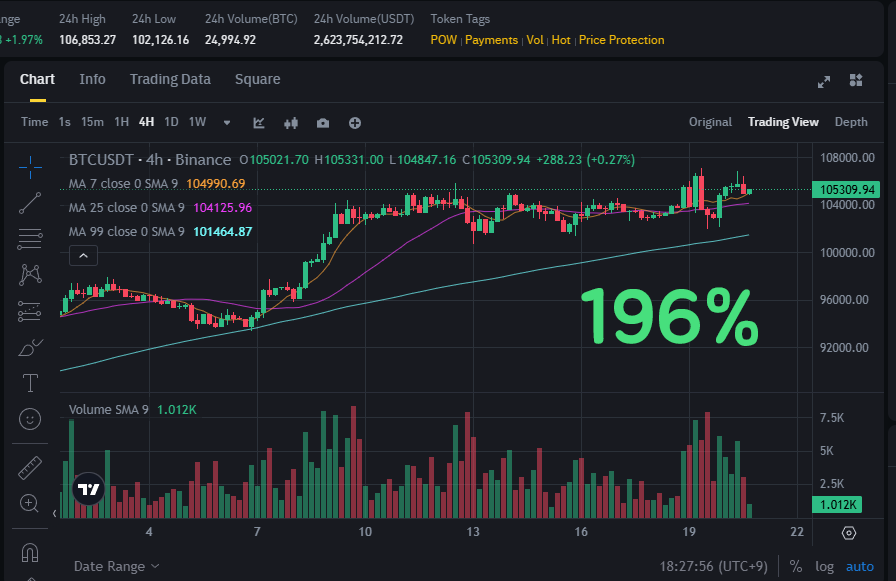
📊 BTC/USDT (Binance, 4H Chart) AI-Based Market Analysis Report
Bitcoin Current Price: $105,309.94
Timestamp: May 19, 2025 – 18:27 (UTC+9)
Chart Platform: Binance, 4-Hour Candles
✅ Key Technical Indicators Summary
| Indicator | Current Value | Interpretation |
|---|---|---|
| MA 7 (Short-Term) | 104,990.69 | Acting as local support |
| MA 25 (Medium-Term) | 104,125.96 | Uptrend holding strong |
| MA 99 (Long-Term) | 101,464.87 | Long-term bullish structure confirmed |
| Volume SMA 9 | 1.012K | Increasing volume = potential breakout signal |
🔍 Technical Analysis
- Moving Average Alignment (MA7 > MA25 > MA99)
→ A classic bullish trend structure with all key moving averages aligned in an upward direction. - Attempted Breakout from Horizontal Range
→ Price is breaking above the resistance zone of 104,400–105,000 USDT with rising volume.
→ A confirmed close above this range could open room toward 107,000–108,000 USDT. - Volume Trend
→ Buying volume has increased during recent rebounds, suggesting genuine accumulation rather than speculative movement.
📈 Forecast Scenarios
📆 Short-Term Forecast (Next 24 Hours)
| Scenario | Price Range | Probability |
|---|---|---|
| Bullish Scenario | 106,500 ~ 108,000 USDT | 72.5% |
| Pullback Scenario | Retest of 104,000 ~ 104,500 USDT | 22.3% |
| Bearish Breakdown | Drop below 102,000 USDT | 5.2% |
🔺 Bullish outlook favored.
The recent breakout is supported by increasing volume and aligned MAs. If buying pressure sustains, the next resistance near 106,800 USDT may be tested soon.
📆 Mid-Term Forecast (1–2 Weeks)
- Overall trend remains strongly bullish as long as the MA99 support at 101,500 USDT holds.
- Within 1–2 weeks, BTC could potentially reach the 110,000 USDT range if momentum continues.
🧠 Summary & Recommendation
Bitcoin is currently breaking out of a key resistance zone between 104,400 and 105,000 USDT, with strong support from volume and bullish moving average alignment. Short-term breakout momentum looks sustainable, and any dip may provide a buying opportunity.
📌 Suggested Stop-Loss: Below 103,500 USDT
📌 Optimal Entry Zone: 104,800 ~ 105,200 USDT
📌 Targets: Short-term – 106,800 USDT / Mid-term – 110,000 USDT
Bitcoin #BitcoinAnalysis #BTCForecast #CryptoPricePrediction #BinanceTrading #BybitSignals #CryptoChartAnalysis #AITradingTool #BitcoinTargetPrice #BTCBullRun #TechnicalAnalysis #AIChartPredictor #CryptoInvestmentTips #BTCTradingView