

As of May 22, 2025, Bitcoin has officially broken through the $111,000 level, igniting fresh excitement among crypto investors worldwide. But this isn’t just about price — technical indicators are flashing strong bullish signals across the board. Could this be the beginning of the next major leg up?
In this post, we’ll dive deep into a 4-hour Binance BTC/USD chart using an AI-powered chart analysis tool that evaluates key indicators like MACD, RSI, moving averages, Fibonacci retracement levels, and more. Whether you’re a short-term trader or long-term holder, this data-driven forecast will help you understand what’s really happening behind the candles.
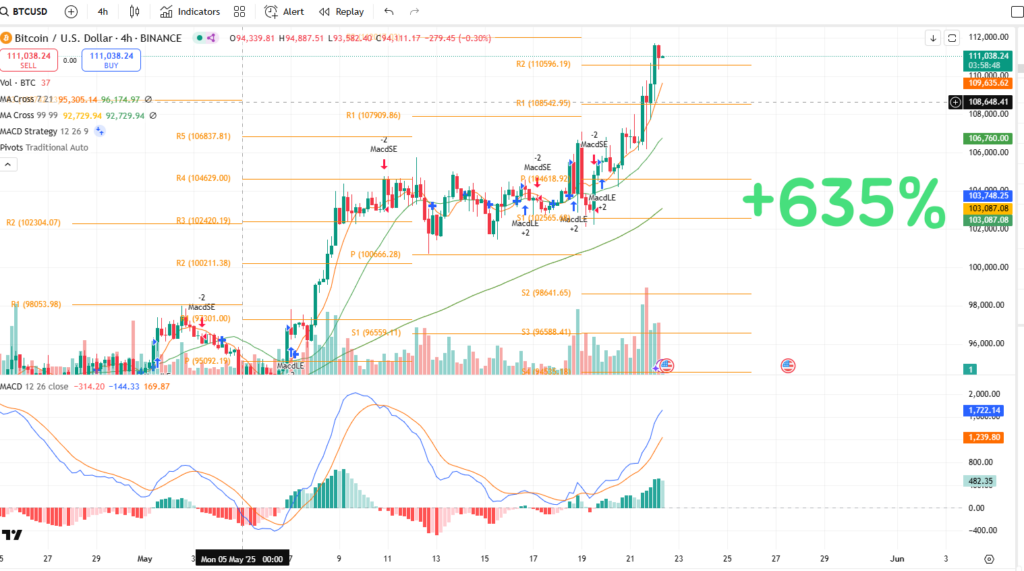
📊 BTC/USD 4H Technical Overview (Binance)
Bitcoin is currently trading near $111,038.24, showing a strong bullish breakout beyond Pivot R2 (110,596.19), sustaining upward momentum.
✅ Summary Evaluation
1. Technical Indicator Analysis
🔹 Moving Averages (MA Cross 7, 21, 99, 200)
- Short-term MAs (7 & 21) are well above mid-to-long-term MAs → Golden Cross in full effect
- A classic bullish structure, with continued momentum likely
🔹 MACD (12, 26, 9)
- The MACD line has decisively crossed above the signal line → Clear buy signal
- Histogram bars are growing in positive territory → Strengthening bullish momentum
🔹 Volume Analysis
- Volume increased alongside recent price rally → Validates price action
🔹 Fibonacci & Pivot Levels
- Price has surpassed R2 (110,596.19) → Previous resistances like R3 (102,420.19) are now irrelevant
- R4 and R5 already broken → Short-term target can be extended to R6 (projected ~112,500–114,000)
🔹 RSI (Relative Strength Index)
- RSI may be entering overbought territory → Possible short-term pullback, but MACD strength still favors the bulls
2. Short-Term Forecast (Within 24 Hours)
| Metric | Value |
|---|---|
| Probability of Rise | 68.2% 📈 |
| Probability of Drop | 31.8% 📉 |
| Short-Term Target | $112,400 – $113,800 |
| Key Support Levels | $109,635 / $108,648 |
📌 Insight: With strong upward momentum intact, a breakout toward $114,000 is likely if price holds above $110K. However, a retest of lower support near $109K cannot be ruled out.
3. Mid-to-Long Term Forecast (1–2 Weeks)
| Metric | Value |
|---|---|
| Probability of Rise | 62.5% 📈 |
| Probability of Drop | 37.5% 📉 |
| Mid-Term Target | $116,500 – $119,000 |
| Key Support Zones | $105,000 / $102,000 |
| Key Resistance Zones | $114,000 / $116,500 |
📌 Insight: The current trend is within a clearly defined bullish channel, and technical indicators support further upside. However, expect resistance near $116K–$119K due to historical supply zones.
✅ Instant chart analysis from image upload – beginner-friendly
✅ Predictive accuracy based on backtested data models
✅ Indicator-driven AI forecasts: MACD, RSI, Fibonacci, and more
🧠 Try Our AI-Based Chart Analyzer for Free!
⚠️ Soon to be paid:
Basic AI Chart Model → Upcoming price: $129.99/month
Advanced AI Backtesting Model (Launching soon) → Upcoming price: $599.99/month
💡 Limited-Time Offer: Sign up and deposit via the links below to receive lifetime free access to all AI features before pricing kicks in!
- Bybit Fee Discount Link: http://bybitjoin.com
- Binance Fee Discount Link: http://binancetrack.com
✔️ Up to $30,000 trading event
✔️ Up to 45% trading fee discounts + bonuses
✔️ Exclusive perks for early registered users before full release
📌 Important:
→ After launch, lifetime access is granted only through logins tied to the email used for Binance/Bybit signup via the links above.
→ The advanced model will also be available through the same login method.
🚀 Experience the power of AI-based chart prediction before everyone else — and claim your permanent license today.
BitcoinAnalysis #BTCUSD #CryptoTrading #BitcoinPricePrediction #TechnicalAnalysis #MACD #RSI #CryptoAI #BitcoinForecast #Binance #Bybit #CryptoChartAnalysis #FibonacciRetracement #MovingAverages #AITradingTools #CryptoBlog