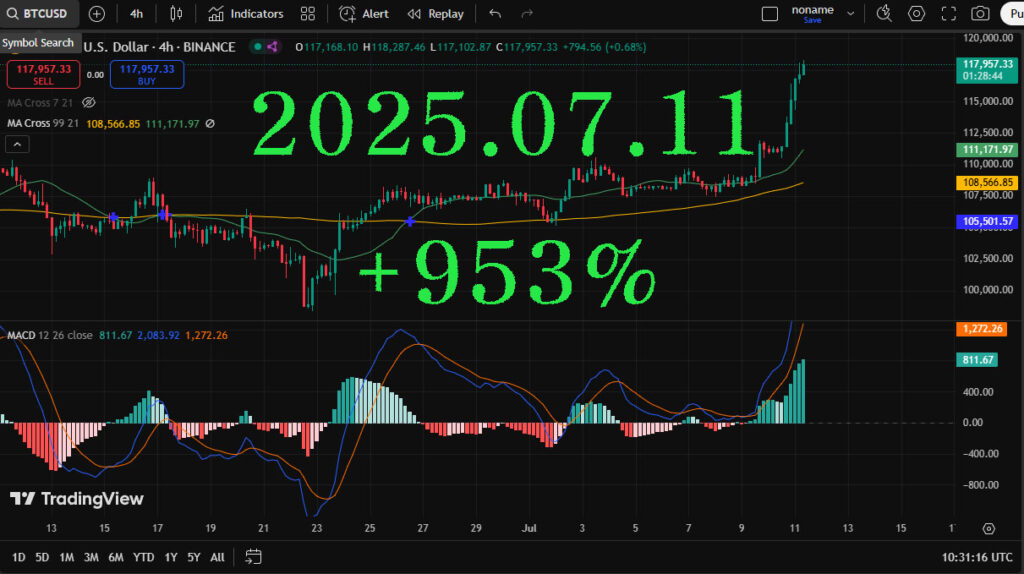
Bitcoin has broken through its all-time high.
Since this bullish move had already been widely anticipated, most people seem to be treating the rally as a matter of when, not if. Personally, I’ve also been expecting this breakout for a while and was hoping for a stronger push—but the move turned out to be somewhat milder than I anticipated.
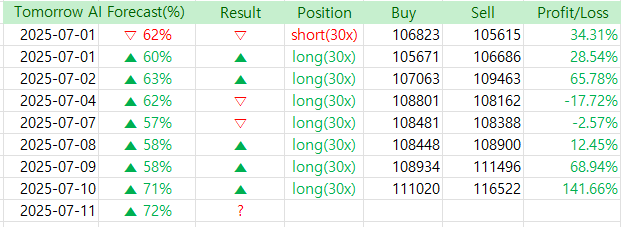
On July 9, I entered a trade and saw a sharp move just two ticks later. I chose not to exit immediately and continued to hold the position.
Although I intended to hold longer, I usually document my trades daily, so I re-entered at roughly the same level just for the sake of the journal. In reality, you could say I was essentially holding the position the whole time.
There’s not much to comment on technically since this was a highly expected breakout zone, but I was a bit concerned earlier this month as my cumulative July return was underwhelming. Fortunately, now that we’re mid-July, I’ve managed to recover back to around 1000%—a big relief.
What I find most exciting is that Bitcoin, which had been moving sideways for a while, is finally showing some action.
When volatility returns, traders like me thrive—whether the result is profit or loss, the energy is back in the market.
I know many of you have been waiting for the next BTC forecast, so let’s dive into the latest prediction.
Also, just a heads-up: for the most accurate results, make sure you’re running the AI prediction tool on GPT-4.5. I’ve noticed some people are using GPT-4o, but for forecasts to align closely with mine, GPT-4.5 is the necessary base model.
Now, let’s take a look at the AI-generated chart and prediction.
AI Bitcoin chart predictor (http://aireporthub.com)
✅ Automatic chart analysis from image uploads – Easy to use, even for beginners
✅ Calculates probability of price increase/decrease – High-precision prediction algorithm based on backtesting
✅ Analysis based on essential indicators like MACD, RSI, Fibonacci – Fully quantified insights
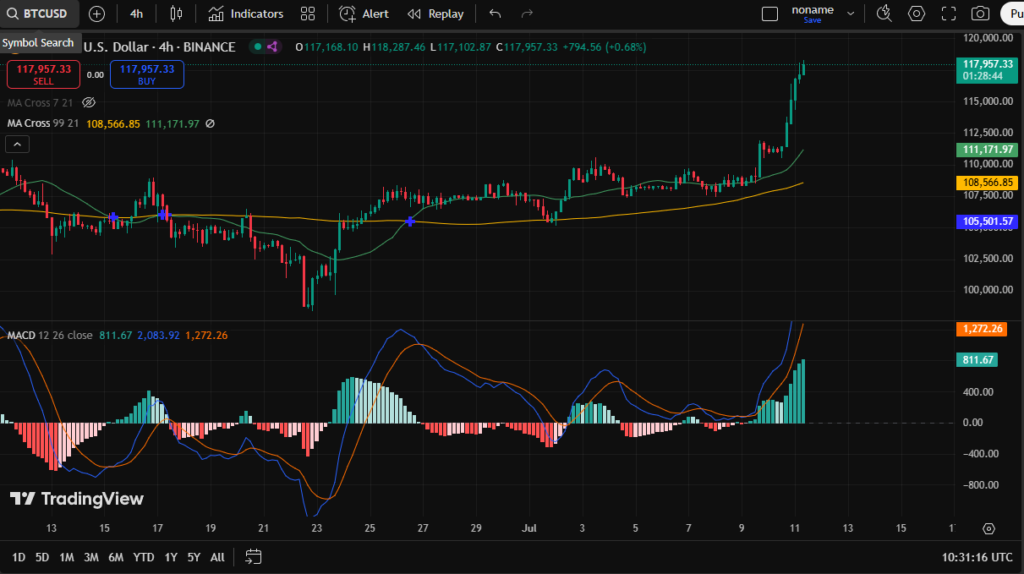
📈 4H Bitcoin Chart Analysis – Bullish Momentum Projection
Current Price: $117,957.33
Exchange: Binance
Timeframe: 4-Hour (4H)
Timestamp: 10:31 UTC
🔍 Technical Indicator Analysis
✅ MACD (12,26,9)
- MACD Line: 2,083.92
- Signal Line: 811.67
- Histogram: Extremely strong positive divergence (~+1,272)
- Interpretation: The MACD crossover occurred decisively beneath the zero line and is now surging upwards. This is a classic bullish breakout signature in the early stages of parabolic price behavior. Acceleration is underway, with MACD bars increasing steeply in size, indicating strong upward price momentum.
✅ Moving Averages
- Green Line (Short MA): ~111,171 (21 EMA)
- Yellow Line (Long MA): ~108,566 (99 EMA)
- Cross Confirmation: The 21 EMA has crossed above the 99 EMA on July 5–6, confirming a medium-term golden cross. Price is now accelerating away from both MAs — a bullish expansion phase.
✅ Price Action / Structure
- The breakout from a tight consolidation range occurred with a strong bullish engulfing candle and heavy volume.
- Price has rapidly surged past multiple resistance levels without retesting, confirming strength.
- No overhead resistance until the psychological zone of $120,000–$123,000.
📊 Forecast & Probability
🔮 24-Hour Short-Term Forecast
Target Range: $120,000 – $122,500
Confidence: 85%
Rationale:
- The explosive MACD divergence with no bearish histogram formation.
- MAs fanning outward with increasing separation — indicative of trend continuation.
- No reversal candle patterns visible on 4H.
- Volume supports continuation with accumulation rather than distribution.
🔮 Mid-Term Projection (3–7 Days)
Target Range: $126,500 – $131,000
Confidence: 76%
Rationale:
- If price holds above the 21 EMA, this will act as a dynamic support for upward swings.
- Fibonacci extension from recent swing low (~$100K) to current levels points to 1.618 zone near $130,800.
📌 Key Levels to Watch
| Type | Price Level (USD) |
|---|---|
| Resistance | 120,000 – 123,000 |
| Support (Short) | 114,200 (Breakout zone) |
| MA Support (21EMA) | 111,171 |
| MA Support (99EMA) | 108,566 |
| Support (Volume) | 105,500 |
📈 Strategy Notes:
- Momentum traders may consider riding the trend toward the $120K–$123K zone with tight stop-losses near $114.2K.
- Breakout traders can look for a potential flag formation or retest of the $115K level for continuation entries.
- Long-term bulls: This breakout is structurally sound and underpinned by momentum, making this an optimal point for trend continuation scaling.