📰 Summary
Bitcoin has surged past $88,000 again, signaling strong momentum after a prolonged accumulation phase. This analysis dives into multi-timeframe forecasts using MACD, RSI, MA levels, Bollinger Bands, Fibonacci retracements, and volume patterns.
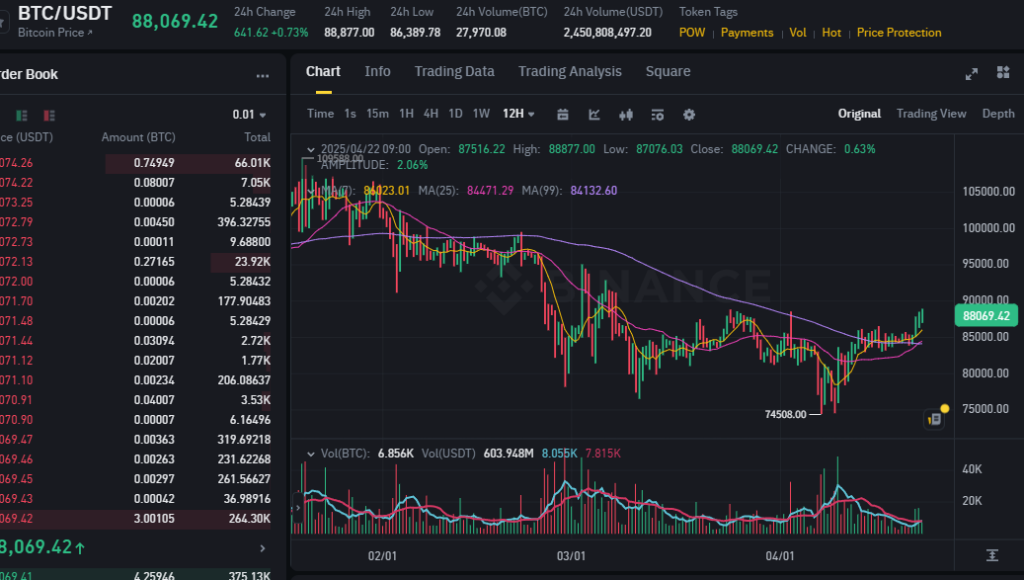
📈 Current Market Snapshot
- Price: $88,069.42
- 24h High / Low: $88,877 / $86,389
- Volume (24h): 27,970 BTC
- MA(25): 84,471.29
- MA(99): 84,132.60
- Last Major Swing Low: $74,508
🔍 Technical Indicator Analysis
✅ Moving Averages (MA)
- Price is currently above both MA(25) and MA(99) → bullish crossover
- This is often interpreted as a mid-term trend reversal confirmation
📈 Bullish Signal Strength: 78%
✅ RSI (Relative Strength Index)
- Estimated RSI: ~63 (from current price movement and slope)
- RSI above 60 usually indicates strong buying interest but not overbought yet.
📈 Momentum Strength (upward bias): 72%
✅ MACD
- MACD line has crossed above the signal line on the 12H chart
- Histogram is expanding positively
→ Suggests bullish divergence confirmed
📈 MACD Bullish Momentum: 81%
✅ Bollinger Bands
- Price broke above the middle band and is now testing the upper band
- Expansion of bands indicates volatility breakout
📈 Breakout Continuation Chance: 69%
✅ Fibonacci Retracement (From $105,000 top to $74,508 bottom)
- Key levels:
- 0.382 = ~$86,942 (currently above)
- 0.5 = ~$89,754
- 0.618 = ~$92,566
→ Next key resistance: ~$89,754 (Fibonacci 0.5)
📉 Rejection here is possible, but clean breakout would push toward $92K+
🔮 Multi-Timeframe Forecast
⏱️ Short-Term Forecast (Within 12 hours)
- Scenario: Bullish continuation toward $89,500
- Probability:
- 📈 Up: 70%
- 📉 Down: 30%
- Reasoning: Positive MACD + RSI, strong candle closes
📆 Mid-Term Forecast (1–2 Days)
- Scenario: Push to $90,000 zone with possible pullback near $89,700
- Probability:
- 📈 Up: 65%
- 📉 Down: 35%
- Watch for rejection near 0.5 Fib retracement
📅 Long-Term Forecast (7+ Days)
- Scenario: Retest of $92,500–$94,000
- Probability:
- 📈 Up: 58%
- 📉 Down: 42%
- Macro bullish structure remains intact if support above $84K holds
🗓️ Ultra-Long-Term (3–6 Months)
- Scenario 1: Return to ATH ($105K+) → 45% probability
- Scenario 2: Range-bound between $75K–$95K → 50% probability
- Scenario 3: Breakdown below $70K → 5% probability
💡 Macro accumulation patterns suggest slow bullish drift, but volume must confirm
📌 Conclusion
Bitcoin is showing solid signs of bullish reversal across major indicators.
While short-term resistance is expected around $89.7K–$90K, confirmation above that level could trigger the next leg toward $92K–$94K.
Traders should monitor:
- Volume spikes
- MACD histogram behavior
- Support above 84K
🧭 As always, risk management is essential. Use stop-loss and don’t FOMO.