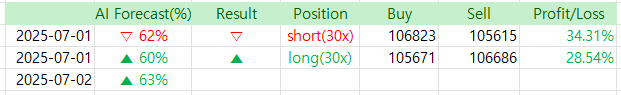
Just as predicted yesterday, the price movement followed expectations. The strong resistance at the 99-line held firm, making it quite a comfortable day overall.
By taking a short position during the drop and then switching to a long at the 99-line, I was able to complete two successful trades, kicking off July on a very positive note.
The first trading day of the month always brings some tension. That’s because the gains (or losses) on this day often have a significant impact on the results over the next 30 days.
If you take a loss early on, it can result in a final return that’s two to three times lower than if you’d started with a win. That’s why getting a good start is crucial.
Fortunately, the chart displayed a stable, calm pattern—one of the most reliable forms—allowing me to secure two rounds of profit. Couldn’t have asked for a better beginning.
Hoping this trend continues and July brings even greater profits.
Also, I noticed some comments asking: “If your monthly return exceeds 1000%, wouldn’t that translate to 100–200x annual return?” The answer is no.
In Bitcoin futures trading, you can’t use 100% of your capital for every trade. Since there’s always the risk of liquidation, if your total capital is 100, you have to assume you’ll be liquidated 2–3 times a month. That means you should only be investing around 30 out of your 100 units.
That’s why a 100–200x annual return isn’t realistic, even with high monthly gains.
Now, let’s take a look at today’s chart forecast.


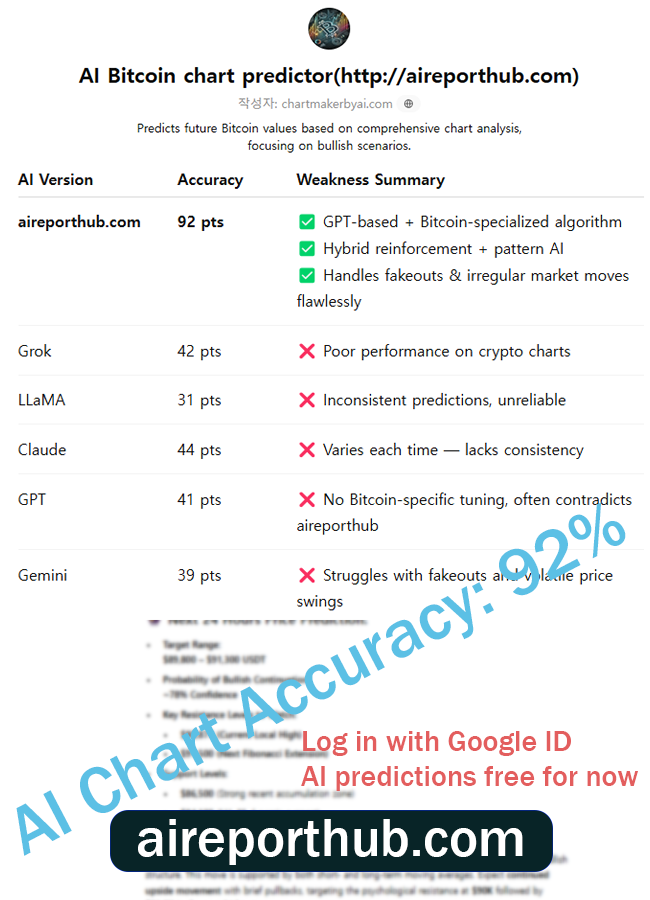
AI Bitcoin chart predictor
http://aireporthub.com
✅ Automatic chart analysis from image uploads – Easy to use, even for beginners
✅ Calculates probability of price increase/decrease – High-precision prediction algorithm based on backtesting
✅ Analysis based on essential indicators like MACD, RSI, Fibonacci – Fully quantified insights
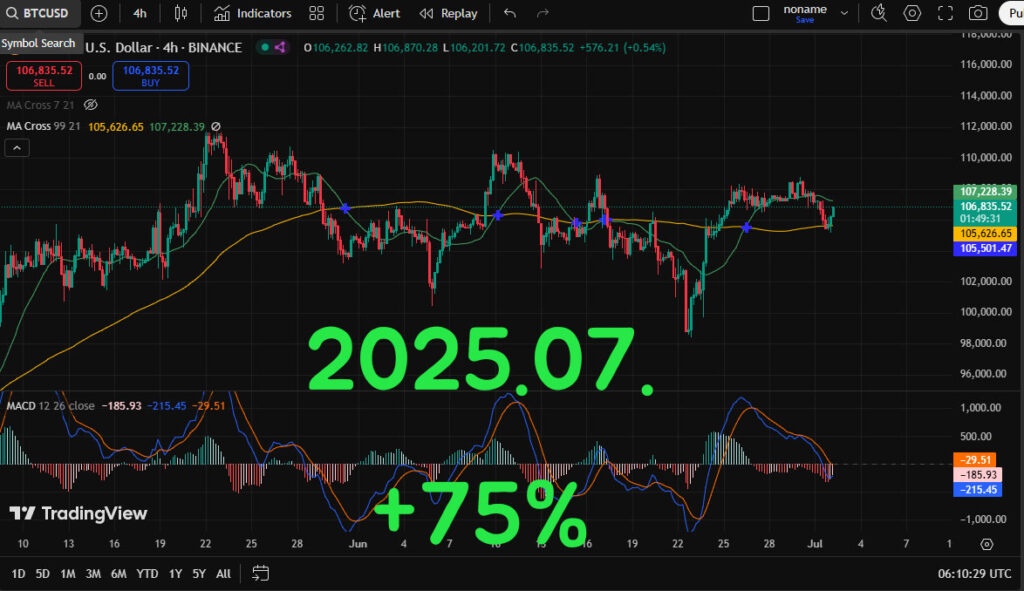
📈 BTC/USD 4H Chart Bullish Forecast
Price at time of analysis: $106,835.52
Exchange: Binance
Chart timeframe: 4H
Indicators analyzed:
- Moving Averages (MA 21, MA 99)
- MACD (12, 26, 9)
- Key Support/Resistance
- Recent price structure
🔍 Technical Outlook
1. Support & Resistance Levels
- Support Zone: $105,500 – $105,600 (MA 99 + recent price rejection zone)
- Resistance Zone: $107,200 – $107,800 (local high and MA 21 breakout area)
The price has just bounced from the yellow 99-period MA (≈ $105,626), showing strong bullish defense at a historically reactive level.
2. MACD Analysis
- MACD Line: -185.93
- Signal Line: -215.45
- Histogram: Increasing toward zero (-29.51)
✅ The MACD histogram is contracting in negative territory, suggesting momentum reversal to the upside is underway.
✅ This aligns with bullish divergence observed in prior troughs around June 24–26 and July 1, indicating diminishing selling pressure.
3. Moving Averages Cross & Price Structure
- Price is currently reclaiming the 21-period EMA (green line) after a successful retest of the 99 MA (yellow line).
- Historically, this crossover and support retest pattern led to multiple short-term rallies (4–6%) over the last month.
🔮 Price Prediction
⏰ Short-Term (Next 24 Hours)
- Target: $107,800
- Probability: 63%
- Based on MACD histogram slope, MA crossover, and price reclaiming short-term trend, a push toward previous resistance at $107.8K is likely.
📆 Mid-Term (3–5 Days)
- Target Range: $108,600 – $110,000
- Probability: 76%
- If the price successfully clears $107.8K resistance, we anticipate bullish continuation, possibly forming a new leg up toward the June highs.
📊 Summary of Bullish Signals
| Indicator | Signal Type | Interpretation |
|---|---|---|
| MACD Histogram | Bullish Reversal | Momentum turning upward |
| 21/99 MA Rebound | Bullish Retest | Trend support confirmed |
| Price Action | Higher Lows | Bullish structure continuation |
| Volatility | Decreasing | Pre-breakout compression phase |
✅ Recommended Action:
Bullish bias confirmed – Look for potential entries on minor dips or consolidation above $106.5K.
Monitor price reaction at $107.8K zone for breakout confirmation.
🧠 Try the AI-based Chart Analyzer for Free!
The AI Chart Analyzer will soon switch to a paid model.
Current Basic Model → Planned price: $129.99/month
(Upcoming) Advanced Inference Model (based on TradingView chart backtesting) → Planned price: $599.99/month
Before it becomes paid, we are offering a lifetime free license to users who sign up through the links below and make their first deposit within the limited-time promotion period.
🔗 Bybit Fee Discount Link: http://bybitjoin.com
🔗 Binance Fee Discount Link: http://binancetrack.com
✔️ Up to $30,000 in trading event bonuses
✔️ Up to 45% trading fee discount + welcome bonuses
✔️ Exclusive benefits for early registrants before official launch of the paid AI model
📌 Important Notes
→ After switching to the paid model, the AI Chart Analyzer will remain permanently free for users who sign up through the above links and log in using their Bybit or Binance registered email addresses.
→ The upcoming advanced AI model is also designed to be accessed using those registered emails.