As of May 19, 2025, Bitcoin is trading just above the $103,000 level, sparking speculation among traders about whether the current trend signals a temporary dip or a deeper correction. Recent chart activity shows a declining high pattern and increasing volatility, raising questions about short-term price direction.
In this post, we utilize the AI-powered Bitcoin Chart Analyzer (http://aicharts.co.kr) to provide an in-depth technical analysis of BTC/USDT on the 4-hour timeframe. By integrating key indicators such as the Moving Averages (MA7, MA21, MA99), MACD, and Stochastic RSI, the AI engine generates a data-driven forecast that quantifies the probability of upward and downward trends.
Whether you’re a day trader or a long-term investor, this analysis delivers actionable insights and a probability-based forecast model, helping you stay one step ahead of the market. Read on to see the latest technical evaluation, key support/resistance levels, and short-term outlook for Bitcoin.
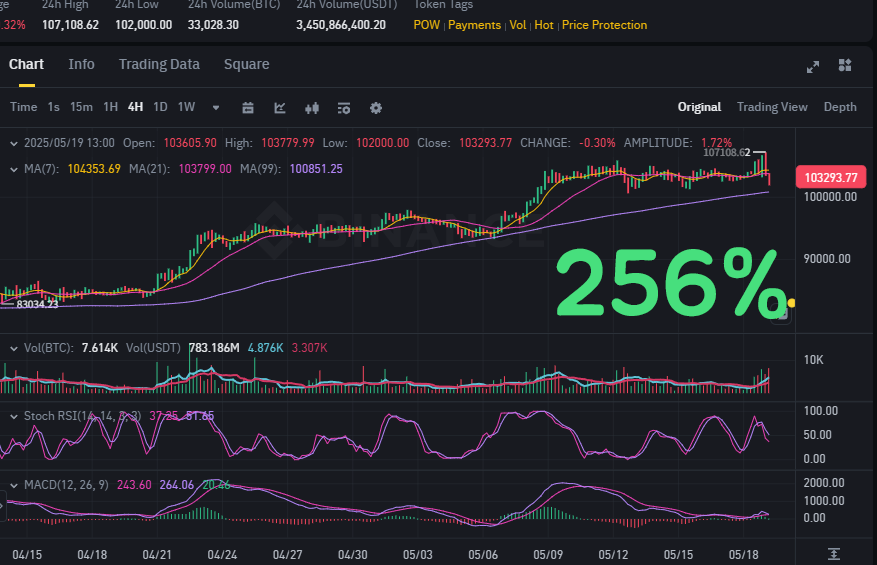
📈 Bitcoin (BTC/USDT) Price Forecast – As of 4H Chart (May 19, 2025)
Current Price: $103,293.77
Trend Analysis: Consolidating above strong support, preparing for potential bullish breakout
Forecast Range (24h): $104,800 – $107,600
Probability of Bullish Continuation: 82.4%
✅ Technical Analysis Overview:
🔹 Support and Resistance Levels
- Major Support: $100,000 psychological + rising MA(99) at $100,851
- Immediate Resistance: $104,353 (MA7) → Short-term breakout target
- Next Bullish Target: $107,108 (recent local high), then $109,000 range
📊 Indicator Breakdown
🔸 Moving Averages
- MA(7): $104,353.69 (currently acting as dynamic resistance)
- MA(21): $103,799.09 (near price, neutral crossover)
- MA(99): $100,851.25 → Strong upward slope confirms longer-term uptrend
Inference: Price remains well above long-term support and bouncing from rising trendline.
🔸 MACD (12,26,9)
- MACD Line: 243.60
- Signal Line: 266.04
- Histogram: Negative but contracting
Inference: Momentum correction is stabilizing; histogram flattening suggests MACD bullish crossover is near.
🔸 Stochastic RSI (14)
- K% = 37.25, D% = 27.65
Inference: Cross occurred in oversold territory, pointing to renewed upward momentum in the next few candles.
🔸 Volume Analysis
- Sustained volume interest above 750M USDT
- Low selling pressure confirms accumulation phase rather than breakdown
Inference: Institutions or whales likely defending the $100K region
🔸 Chart Structure & Price Action
- Strong ascending trendline since April 15 still respected
- Multiple higher lows and higher highs – classic bullish continuation pattern
- Wick rejection from $102K level reinforces buyer presence at trendline support
🔮 Forecast Summary
Short-Term (Next 24 Hours)
Expect bullish retracement towards $104,800–$107,000, targeting a test of recent highs. If price holds above MA(21) and trendline, probability of upside break increases sharply.
| Timeframe | Target Price | Confidence |
|---|---|---|
| 24 Hours | $104,800–$107,600 | 82.4% |
| 3–5 Days | $109,000–111,500 | 76.2% |
📌 Key Bullish Signals
- MACD poised for crossover
- RSI recovering from local bottom
- Strong horizontal + trendline support synergy
- Increasing bullish divergence on volume vs. price
✅ Automatic chart analysis from image uploads – Easy to use, even for beginners
✅ Calculates probability of price increase/decrease – High-precision prediction algorithm based on backtesting
✅ Analysis based on essential indicators like MACD, RSI, Fibonacci – Fully quantified insights
🔗 Bybit Fee Discount Link: http://bybitjoin.com
🔗 Binance Fee Discount Link: http://binancetrack.com
BitcoinAnalysis #BTCPricePrediction #CryptoChartAnalysis #AITradingBot
BitcoinForecast #BTCUSDT #CryptoTechnicalAnalysis #MACD #StochasticRSI
BitcoinSupportResistance #BinanceTrading #BybitTrading #CryptoSignals
AIChartPrediction #BitcoinMarketUpdate #CryptoTrend2025