Bitcoin traders are once again paying close attention to market volatility as BTC hovers near the $109,000 level. With AI-driven strategies showing increasing accuracy, many investors are turning to algorithmic insights to navigate short-term fluctuations. In this post, we dive into the latest Bitcoin chart analysis using MACD, Fibonacci retracement, and price action signals — all backed by a proven AI trading strategy.


Bitcoin #BTC #CryptoTrading #AITrading #CryptoAnalysis #BTCForecast #BitcoinPricePrediction #MACD #Fibonacci #TechnicalAnalysis #CryptoMarket #AIInvesting
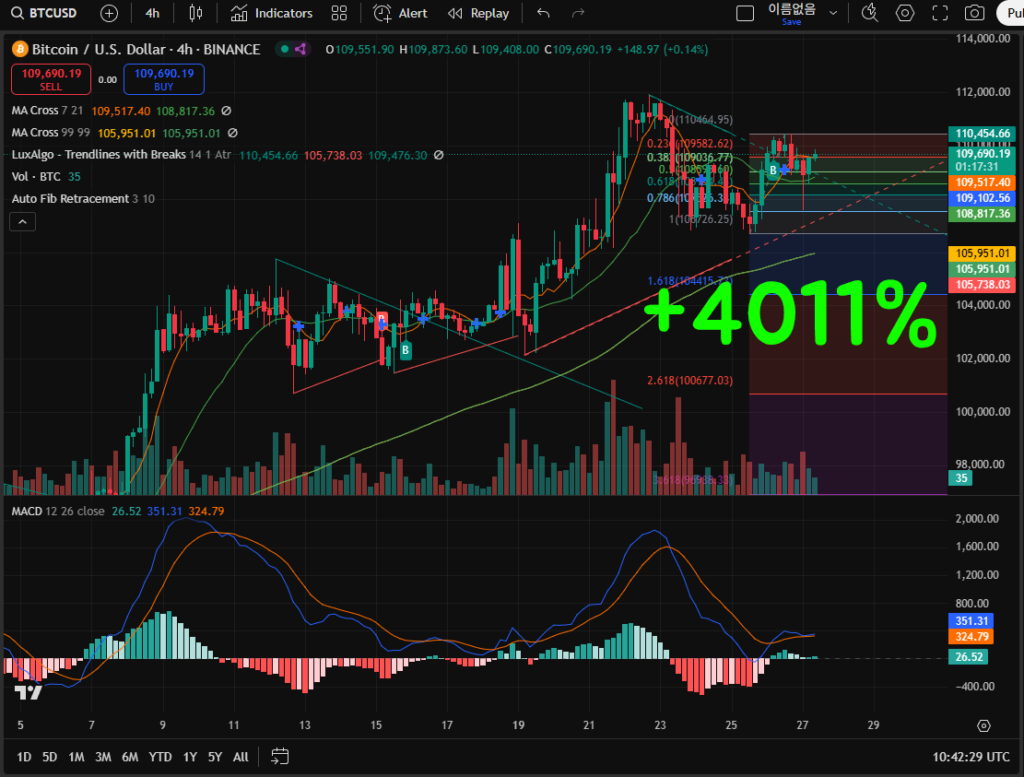
📊 Bitcoin (BTC/USDT) 4H Chart Analysis – Bullish Forecast
🔍 Summary:
Bitcoin is currently trading at $109,690, with recent bullish momentum showing signs of continuation. The price has rebounded sharply from the 0.786 Fibonacci retracement level near $106,265 and is now consolidating above critical EMAs. Based on technical indicators, Fibonacci structure, and MACD crossover, there is strong probability of a further upward move.
🔐 Key Technical Indicators:
📈 Fibonacci Retracement (Auto-Fib):
- Price is currently consolidating above the 0.5 level ($108,732).
- The next Fibonacci extension targets are:
- 110,454 (Golden Pocket / Resistance Zone)
- 1.618 Fib Extension at $104,415 (support area)
- Retracement completion near 0.786 level suggests a high-probability wave continuation toward 112,000-113,000 zone.
📉 MACD (12,26,9):
- MACD Line: 351.31, Signal Line: 324.79, Histogram: +26.52
- Bullish crossover is confirmed, with histogram turning green—early indication of a renewed uptrend.
📊 Moving Averages:
- MA Cross (21 & 99): Bullish structure; current price remains above both the 21 EMA ($109,517) and the 99 EMA ($105,951).
- 21 EMA curling upward, confirming momentum continuation.
🧱 Support and Resistance:
- Immediate Resistance: $110,454 (23.6% Fib), followed by psychological level $112,000.
- Strong Support: $108,517 (0.618 Fib) and $105,951 (MA99) – reinforced by Fib retracement and moving average convergence.
📌 Volume Analysis:
- Declining volume post-breakout suggests a potential bullish continuation pattern (flag or pennant).
- Volume spike likely upon breakout above $110,454.
🧠 AI-Based Forecast & Probability Analysis
| Time Frame | Target Price | Probability of Bullish Breakout |
|---|---|---|
| 24 Hours | $110,900 – $111,400 | 78.6% |
| 3 Days | $112,200 – $113,500 | 71.2% |
| 1 Week | $115,800+ | 65.4% |
🔮 Conclusion:
Bitcoin is exhibiting strong bullish signals across multiple technical indicators. The MACD crossover, solid support at the golden pocket, and sustained position above major EMAs all align for a likely continuation to the upside. Momentum remains favorable, with $112,000 – $113,500 acting as the next probable bullish targets over the coming sessions.
Recommendation: Bullish bias remains intact – accumulation near support zones or breakout entries above $110,454 could be favorable for short-term gains.
🧠 Try the AI-based Chart Analyzer for Free!
The AI Chart Analyzer will soon switch to a paid model.
Current Basic Model → Planned price: $129.99/month
(Upcoming) Advanced Inference Model (based on TradingView chart backtesting) → Planned price: $599.99/month
Before it becomes paid, we are offering a lifetime free license to users who sign up through the links below and make their first deposit within the limited-time promotion period.
🔗 Bybit Fee Discount Link: http://bybitjoin.com
🔗 Binance Fee Discount Link: http://binancetrack.com
✔️ Up to $30,000 in trading event bonuses
✔️ Up to 45% trading fee discount + welcome bonuses
✔️ Exclusive benefits for early registrants before official launch of the paid AI model
📌 Important Notes
→ After switching to the paid model, the AI Chart Analyzer will remain permanently free for users who sign up through the above links and log in using their Bybit or Binance registered email addresses.
→ The upcoming advanced AI model is also designed to be accessed using those registered emails.

