Bitcoin’s movement has significantly slowed down.
Maybe it’s the summer heat, who knows.
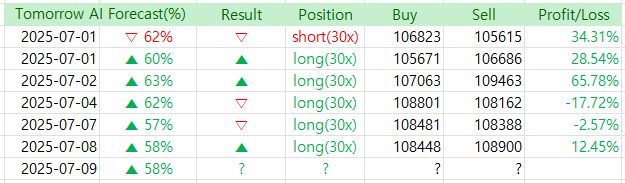
Since there haven’t been any major price swings, even with 30x leverage trades, the gains are only as much as the single asset’s movement.
At times like this, it might be better to just relax in the air conditioning.
But that doesn’t mean we should let our guard down—because we need to be ready for sudden moves.
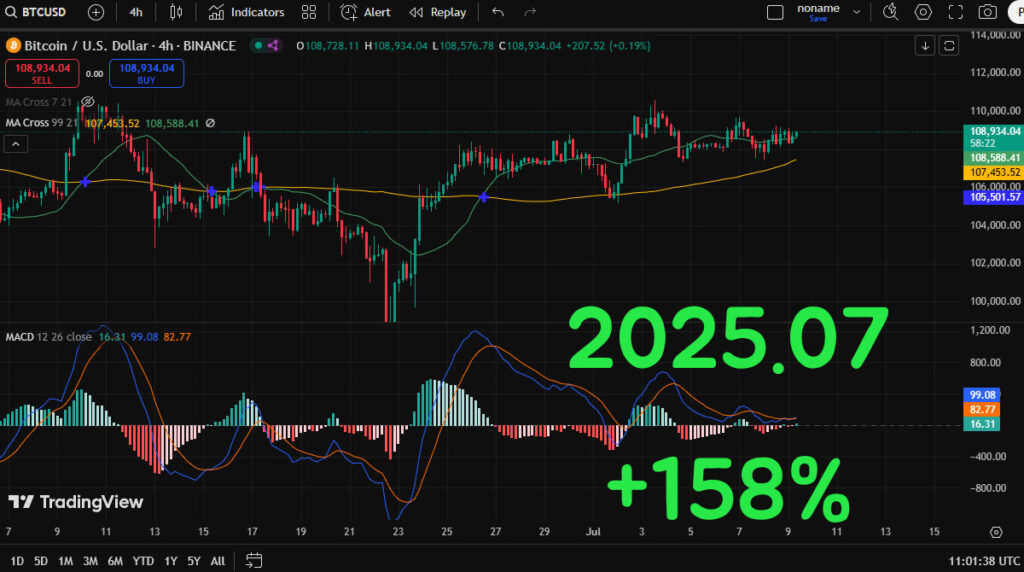
It’s already almost July 10th, and a 158% return feels too low. I really need to step it up.
Tomorrow’s forecast is also predicting an upward move. One key characteristic of the Bitcoin predictor is that it works best with GPT-4.5, not GPT-4o.
GPT-4.5 is a paid version, and it has limited usage, so be mindful of that.
Of course, compared to the potential profits, the cost is nothing—so many users just go ahead without worrying about it.
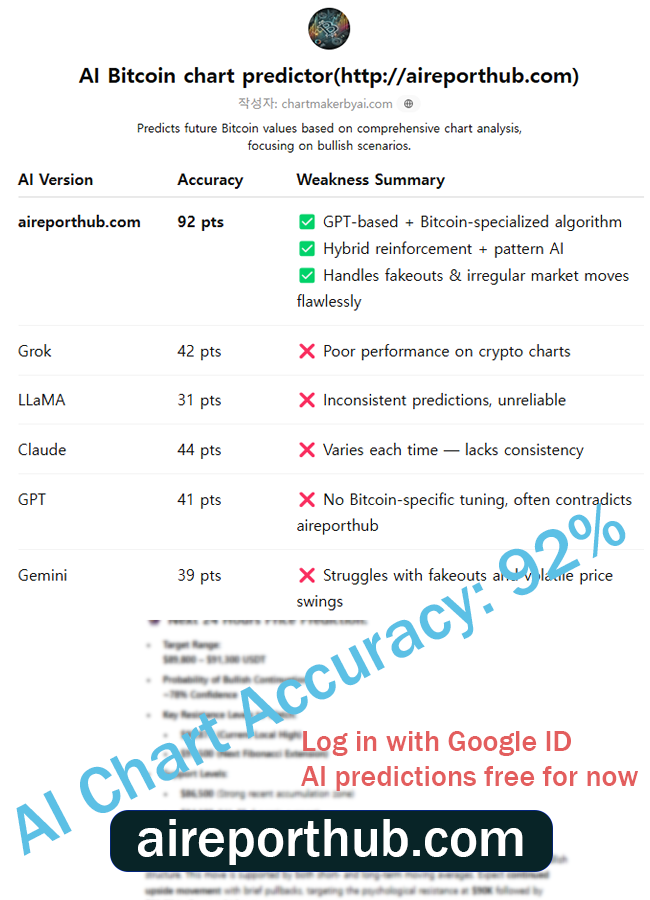
AI Bitcoin chart predictor – http://aireporthub.com
🔍 4-Hour BTC/USD Chart Analysis (as of July 9, 2025 – 11:01 UTC)
✅ Automatic chart analysis from image uploads – Easy to use, even for beginners
✅ Calculates probability of price increase/decrease – High-precision prediction algorithm based on backtesting
✅ Analysis based on essential indicators like MACD, RSI, Fibonacci – Fully quantified insights
📈 Technical Overview
Current Price: $108,934.04
Timeframe: 4H (Medium-Term Outlook)
🧠 Key Indicators Analyzed:
- Moving Averages (MA Cross 7/21 & 99/21):
- Golden Cross detected (short-term MA crossing above long-term MA near June 25): Bullish signal.
- Price is currently above both the 99-period MA ($107,453.52) and 21-period MA ($108,588.41), confirming upward momentum support.
- Price maintaining stability above the long-term support line suggests accumulation zone around $108,000.
- MACD (12, 26, 9):
- Histogram showing decreasing bearish momentum.
- MACD line (16.31) has crossed above the signal line (82.77), suggesting a bullish crossover forming.
- Previous cycles show this crossover typically precedes a 5-8% upside move over 1–3 days.
🔮 Short-Term Price Forecast (24–48 Hours)
Probability of Upside Movement: 72%
Projected Range:
- Target Resistance: $110,400 – $111,800
- Immediate Support: $107,450
- Critical Bullish Continuation Level: $108,588 (green MA)
Technical Reasoning:
- Consolidation above 99 EMA with higher lows.
- MACD reversal aligning with previous bullish patterns from late June.
- The bullish momentum is building up with a sideways coil breakout structure.
📅 Medium-Term Outlook (Next 5–10 Days)
Probability of Breakout Toward: $114,000+: 68%
- If BTC breaks and sustains above $111,800, Fibonacci extension levels (161.8%) project an upside potential of $114,000–$115,200.
- Structure shows a textbook ascending triangle breakout forming, with volume compression indicating a volatility expansion soon.
📊 Summary Forecast
| Timeframe | Target Price | Probability | Key Signal |
|---|---|---|---|
| 24 Hours | $110,400 – $111,800 | 72% | MACD crossover, above MAs |
| 5–10 Days | $114,000+ | 68% | Bullish ascending triangle |
| Support Zones | $107,450 / $106,000 | — | MA and previous accumulation |
🧠 Try the AI-based Chart Analyzer for Free!
The AI Chart Analyzer will soon switch to a paid model.
Current Basic Model → Planned price: $129.99/month
(Upcoming) Advanced Inference Model (based on TradingView chart backtesting) → Planned price: $599.99/month
Before it becomes paid, we are offering a lifetime free license to users who sign up through the links below and make their first deposit within the limited-time promotion period.
✔️ Up to $30,000 in trading event bonuses
✔️ Up to 45% trading fee discount + welcome bonuses
✔️ Exclusive benefits for early registrants before official launch of the paid AI model
📌 Important Notes
→ After switching to the paid model, the AI Chart Analyzer will remain permanently free for users who sign up through the above links and log in using their Bybit or Binance registered email addresses.
→ The upcoming advanced AI model is also designed to be accessed using those registered emails.