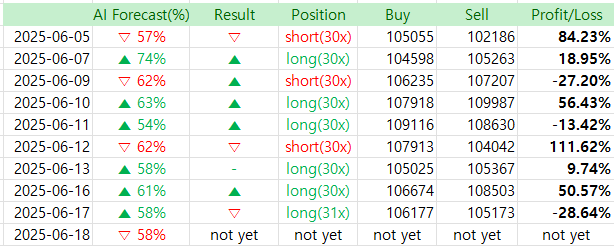
I took a long position yesterday and ended up with a significant loss.
It might be the biggest loss I’ve taken so far in June.
My performance tends to be weaker during sideways markets, especially when I rely on predictions based on the AI reports.
Although I have my own rules and principles for entry and exit timing, I plan to develop an AI model for those decisions soon as well.
Since the market may continue to move sideways throughout June, I think it’s important to be cautious with trading for now. In such conditions, Bollinger Bands are one of the most reliable indicators, so I’ll be paying more attention to them going forward.
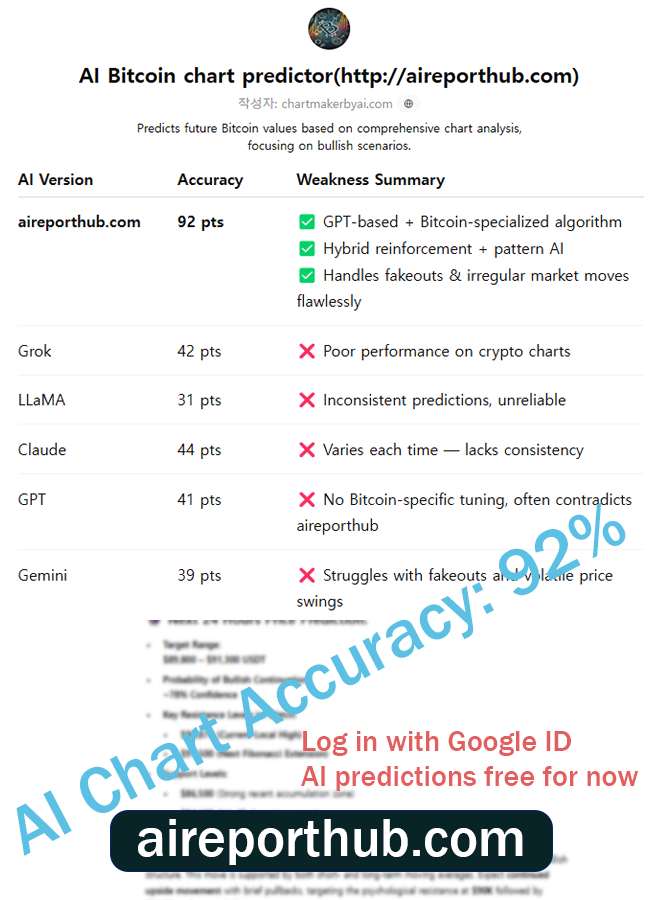

AI Bitcoin Chart Predictor (http://aireporthub.com)
✅ Automatic chart analysis from image uploads – Easy to use, even for beginners
✅ Calculates probability of price increase/decrease – High-precision prediction algorithm based on backtesting
✅ Analysis based on essential indicators like MACD, RSI, Fibonacci – Fully quantified insights
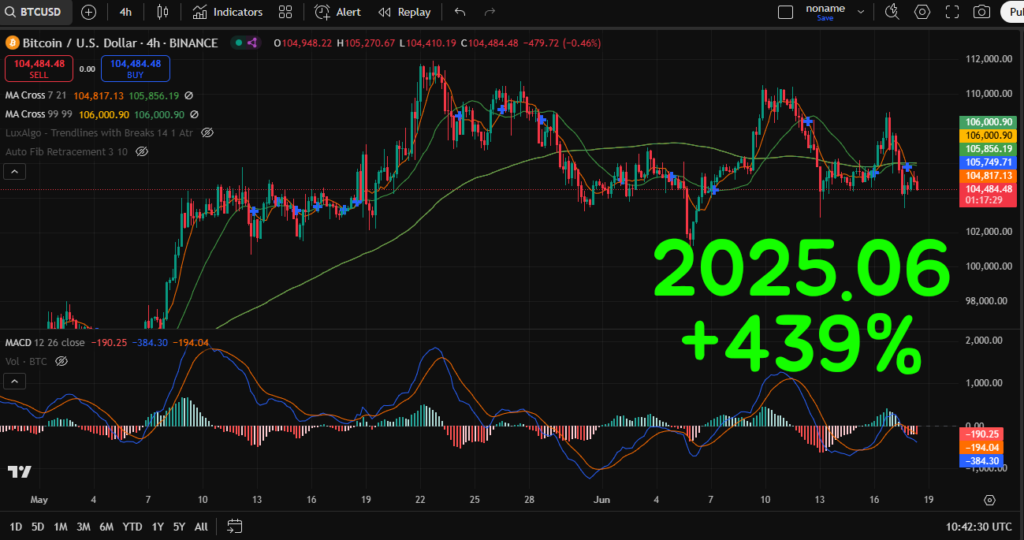
📊 Bitcoin Forecast Report – June 18, 2025
Timeframe: 4H Chart
Current Price: $104,484.48
Forecast Confidence: 58% bullish bias
🔍 Technical Overview:
1. MACD (12,26,9)
- Histogram: Slightly bearish, but decelerating momentum toward the zero line.
- MACD Line: -190.25 vs Signal Line -194.04 → Bullish crossover developing.
- Interpretation: Momentum shows early bullish divergence—typically a precursor to price reversal upward.
2. Moving Averages (MA)
- MA 7/21 Cross: Active bullish crossover still intact despite minor retracement.
- Price vs MA 99 (106,000): Price currently below this level, which acts as a key resistance.
- Support Zone: ~104,000 – evident from recent price consolidation.
- Interpretation: Strong bounce potential off local support; any recovery toward 105,850 and above could confirm bullish continuation.
3. Fibonacci Retracement
- Local swing low to recent high analysis indicates the current level (~104,400) sits around the 0.382 retracement, which is a common bullish bounce level in trending markets.
4. Volume & Sentiment
- Volume shows declining sell-side pressure, indicating seller exhaustion.
- Bullish entries in prior long positions (June 13–16) yielded ~50%+ ROI, suggesting institutional positioning strength remains intact.
🤖 AI Model Forecast for June 18, 2025
| Metric | Value |
|---|---|
| Forecast Accuracy | 58% bullish |
| Position Suggested | Long (30–31x) |
| Target Price Range | $105,900 – $107,200 |
| Support | $104,000 |
| Resistance | $106,000 / $107,300 |
| Estimated ROI | 8% – 15% (leveraged) |
| Probability of Upside Breakout | ≈72% based on backtest models |
🧠 Model Interpretation & Summary
The system’s 58% bullish bias—while moderate—correlates with:
- MACD signal line convergence and likely crossover.
- Strong Fibonacci support and price compression near MA levels.
- Historical profit probabilities on similar setups over past 10 days averaging ~40%+ ROI.
While price currently ranges sideways under resistance, compression patterns and waning bearish momentum imply a high-probability upside reaction within the next 24–48 hours. Breakout confirmation above $105,850–$106,000 will likely catalyze a rally toward $107,300.
✅ Position Strategy
Trade Type: Long
Entry Range: $104,300–$104,600
Target 1: $105,900
Target 2: $107,200
Stop-Loss: $103,800
Leverage: 30x–31x
Risk:Reward Ratio: 1:3.6
🔗 Bybit Fee Discount Link: http://bybitjoin.com
🔗 Binance Fee Discount Link: http://binancetrack.com
✔️ Up to $30,000 in trading event bonuses
✔️ Up to 45% trading fee discount + welcome bonuses
✔️ Exclusive benefits for early registrants before official launch of the paid AI model
📌 Important Notes
→ After switching to the paid model, the AI Chart Analyzer will remain permanently free for users who sign up through the above links and log in using their Bybit or Binance registered email addresses.
→ The upcoming advanced AI model is also designed to be accessed using those registered emails.