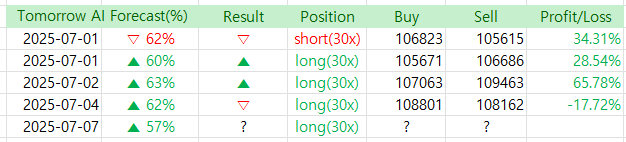
Last week, Bitcoin made a wrong move, causing our return rate to drop to 135%.
Usually, we maintain above 70%, so this result is disappointing.
Still, it’s time to pull ourselves together and approach Bitcoin trading with a fresh mindset — aiming for victory.
While the Nasdaq and Dow keep pushing toward new highs without significant pullbacks, Bitcoin is also holding strong and striving to break its all-time high.
Just a little more upward momentum, and we could see Bitcoin hit its historical peak again — let’s hope it doesn’t take too long.
With the summer heat, make sure to stay mentally steady. I hope your trades lead to great results.
Now, let’s take a look at today’s AI forecast.
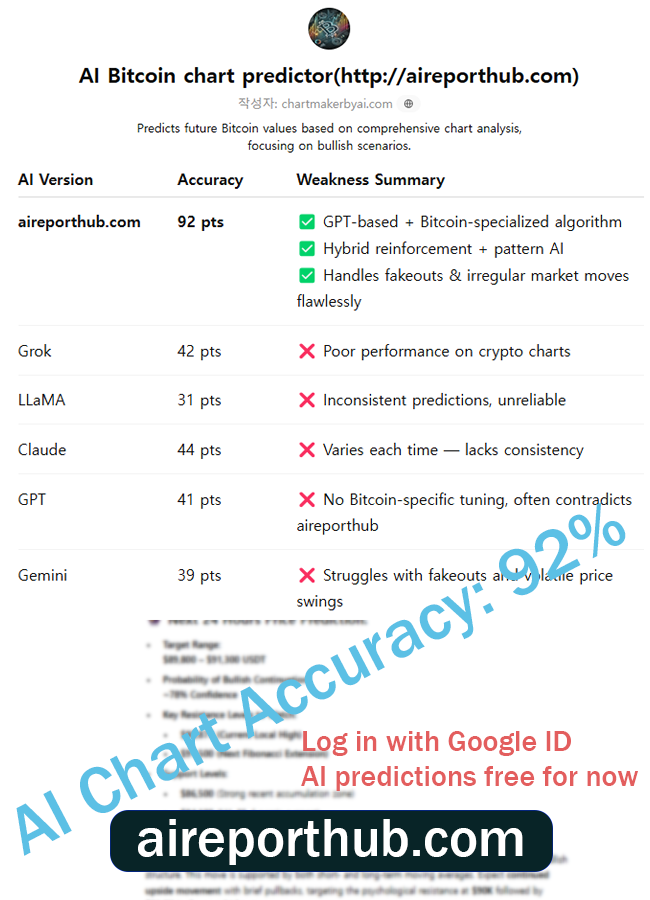
AI Bitcoin chart predictor (http://aireporthub.com)
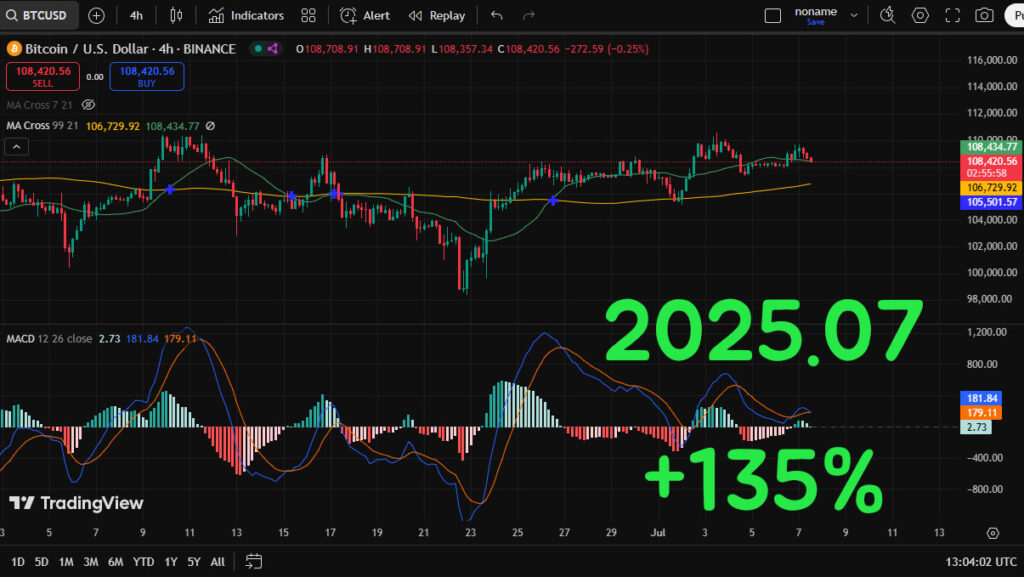
📈 Bitcoin (BTC/USD) 4H Chart Analysis – Bullish Scenario Projection
As of: July 7, 2025 | Price: $108,420.56
✅ Automatic chart analysis from image uploads – Easy to use, even for beginners
✅ Calculates probability of price increase/decrease – High-precision prediction algorithm based on backtesting
✅ Analysis based on essential indicators like MACD, RSI, Fibonacci – Fully quantified insights
🔍 Technical Overview
🧮 Key Indicators (4H Timeframe)
- MACD (12, 26, 9):
- MACD Line: 181.84
- Signal Line: 179.11
- Histogram: +2.73 (Positive momentum)
- ➤ The MACD crossover above the signal line indicates a bullish momentum resurgence. The histogram is moving back into positive territory – a precursor to a bullish divergence.
- Moving Averages:
- MA 21 (green): $108,434.77 (current price is holding above this level)
- MA 99 (yellow): $106,729.92 (acting as strong dynamic support)
- ➤ Price structure remains above both mid- and long-term MAs, confirming ongoing trend strength. The 21-EMA also shows a potential bullish cross above the 99-EMA continuation pattern from the previous weeks.
- Support/Resistance:
- Key Support Levels:
- $106,730 (MA 99)
- $105,500 (Horizontal support based on previous low structure)
- Immediate Resistance:
- $110,000 – Psychological and Fibonacci level
- $112,500 – Local high from June 30
- ➤ BTC is currently compressing within a high-timeframe symmetrical consolidation structure, hovering just above key supports.
- Key Support Levels:
🔮 Price Prediction Scenarios (Bullish Focus)
📅 Short-Term Forecast (Next 24–48 Hours)
- Expected Move: Upside breakout toward $110,800–$112,000
- Probability of Bullish Continuation: 68%
Why?
- MACD crossover + upward histogram shift
- Price maintaining above 21-EMA and 99-EMA
- Consolidation in a higher-low structure = classic bullish pennant breakout formation
📆 Medium-Term Forecast (1–2 Weeks)
- Target: $115,200 – $117,000
- Probability: 72%
Catalysts:
- Positive momentum from histogram and MA alignment
- Rising support trendline holding cleanly
- Lack of major resistance until $117k region (confluence of Fibonacci 1.618 extension from the last swing low)
📊 Quantified Analysis Summary
| Indicator | Signal | Interpretation |
|---|---|---|
| MACD | Bullish | Momentum shift upward |
| MA 21 vs MA 99 | Bullish | Supportive moving average slope |
| Histogram Divergence | Bullish | Early trend strength restoration |
| Support Zone Hold | Strong | High bounce likelihood |
| Resistance Zone | Approaching | Breakout expected above $110k |
📈 Conclusion: Bullish Bias Maintained
Bitcoin is showing strong technical support above $106.7k, while oscillators like MACD signal renewed bullish momentum. Short-term compression patterns suggest an impending breakout toward the $110.8k–$112k range, with room to rally higher toward $115k+ in the coming weeks, assuming macroeconomic stability and continued demand.
🧠 Try the AI-based Chart Analyzer for Free!
The AI Chart Analyzer will soon switch to a paid model.
Current Basic Model → Planned price: $129.99/month
(Upcoming) Advanced Inference Model (based on TradingView chart backtesting) → Planned price: $599.99/month
Before it becomes paid, we are offering a lifetime free license to users who sign up through the links below and make their first deposit within the limited-time promotion period.
🔗 Bybit Fee Discount Link: https://partner.bybit.com/b/2099
🔗 Binance Fee Discount Link: https://accounts.binance.com/register?ref=35439847
✔️ Up to $30,000 in trading event bonuses
✔️ Up to 45% trading fee discount + welcome bonuses
✔️ Exclusive benefits for early registrants before official launch of the paid AI model
📌 Important Notes
→ After switching to the paid model, the AI Chart Analyzer will remain permanently free for users who sign up through the above links and log in using their Bybit or Binance registered email addresses.
→ The upcoming advanced AI model is also designed to be accessed using those registered emails.