🔍 Summary
Bitcoin continues its strong bullish momentum, closing the day at $93,768.49, with a 1.43% daily gain. After reaching a high of $94,444, BTC shows signs of a potential continuation toward the psychological resistance zone near $99,000. However, short-term pullbacks may occur as the market absorbs recent gains.
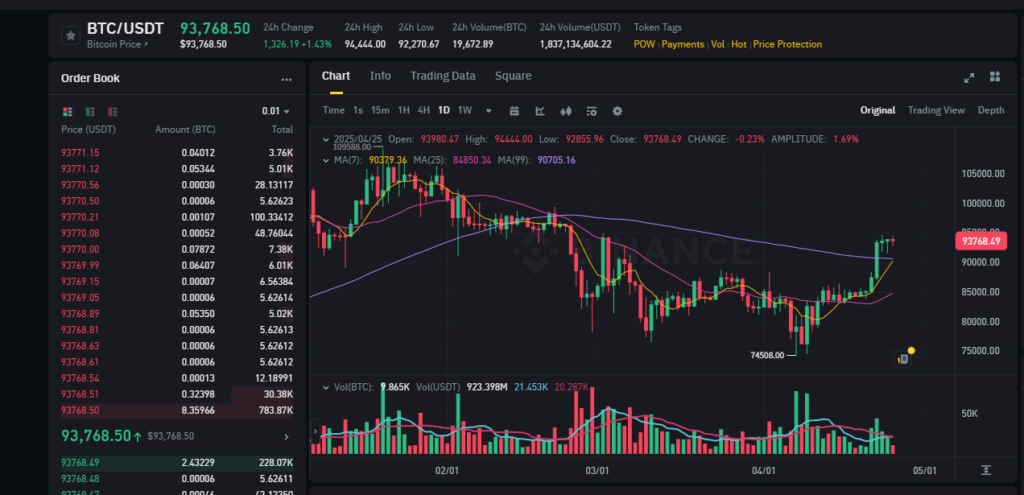
📊 Key Market Data (as of April 25, 2025)
- Price: $93,768.49
- 24h Change: +$1,326.19 (+1.43%)
- High / Low: $94,444.00 / $92,270.67
- 24h Volume: 19,672.89 BTC / $1.837B
- Technical Pattern: Ascending breakout continuation
📉 Chart Overview and Technical Analysis
1. Moving Averages
- 7-day MA: $90,379.36 – Strong short-term support
- 25-day MA: $84,850.34 – Confirmed bullish crossover
- 99-day MA: $90,705.16 – Now acting as potential support post-breakout
✅ The 7-day MA crossed above both the 25 and 99-day lines, a classic bullish signal.
2. Candlestick Pattern & Structure
- BTC formed a clean bullish structure since bottoming out at $74,508 on March 20.
- The steep ascending trendline from early April remains intact.
- Today’s candle shows small upper wicks, indicating mild selling pressure but no strong reversal.
3. Volume & Momentum
- Volume increased significantly during the recent rally, especially after reclaiming the $90K level.
- RSI (not shown) likely entering or near overbought territory; caution is advised on short-term overextension.
🧠 AI Forecast (Next 24–48h)
Probability of upward continuation to 97.5K–99K zone: 72%
Probability of pullback toward 91K–92K zone: 28%