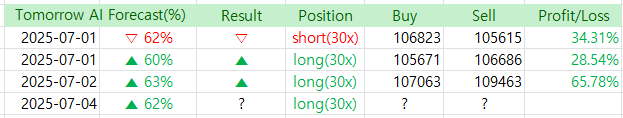
Thanks to the trading profit on July 2nd, we’re kicking off July with a solid 200% baseline gain once again.
The reason I didn’t trade on July 3rd is that the AI forecast showed nearly a 50/50 chance of an upward or downward move, so I decided to sit it out.
Rather than trading frequently, it’s more important to avoid bad trades — that’s why I chose not to act.
Since July is off to a promising start, I hope we can keep up the good momentum.
Let’s take a look at the latest AI forecast.
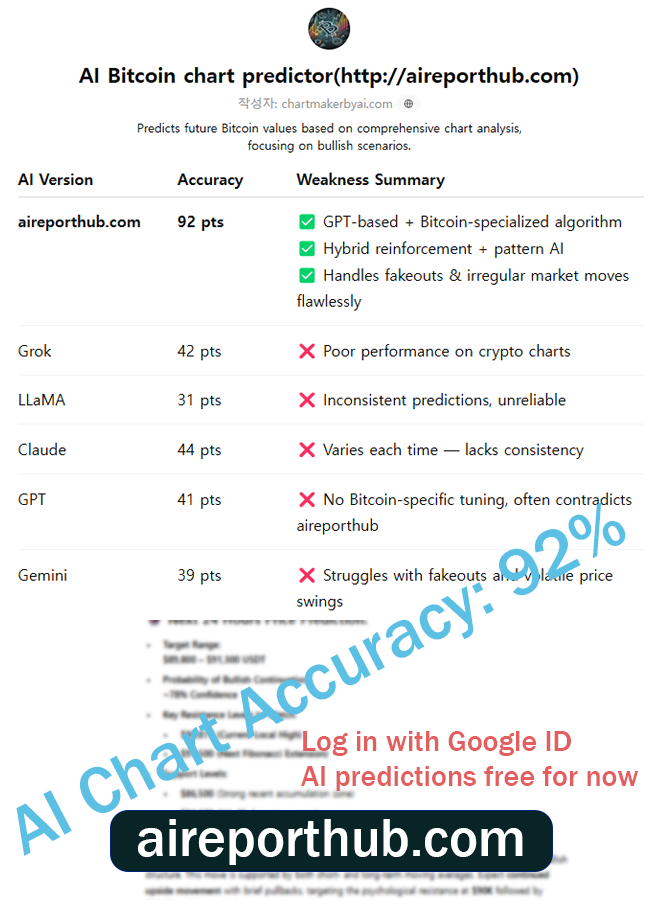
AI Bitcoin chart predictor (http://aireporthub.com)
✅ Automatic chart analysis from image uploads – Easy to use, even for beginners
✅ Calculates probability of price increase/decrease – High-precision prediction algorithm based on backtesting
✅ Analysis based on essential indicators like MACD, RSI, Fibonacci – Fully quantified insights
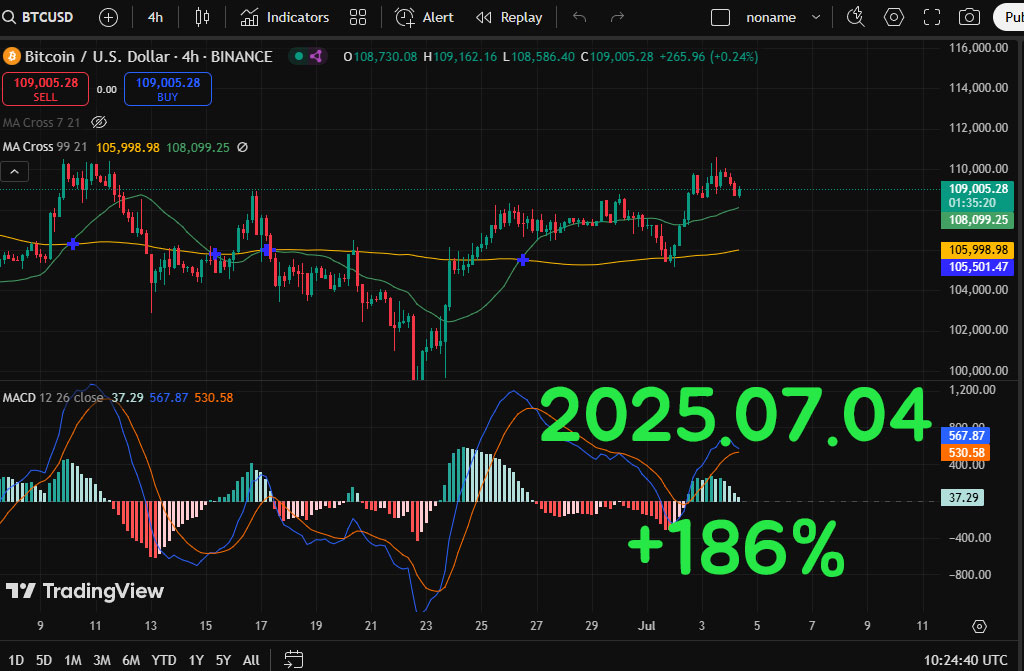
📊 Bitcoin (BTC/USD) 4H Chart Analysis – Bullish Outlook
Current Price: $109,005
Exchange: Binance | Timeframe: 4H | Date: July 4, 2025, 10:24 UTC
🔍 Technical Indicators Summary
1. Moving Averages (MA 7, 21, 99)
- Short-term MA (7, 21) crossover: Bullish momentum initiated on June 30 with the MA-7 crossing above MA-21.
- Price action above MA-99 (105,998.98): Indicates ongoing bullish control and support near $106,000.
2. MACD (12, 26, 9)
- MACD Line (567.87) > Signal Line (530.58): Bullish crossover remains active.
- Histogram: Positive, though slightly decreasing → signaling momentum slowdown but no bearish reversal yet.
3. Support & Resistance
- Immediate Support: $108,100 (MA cluster and previous consolidation level)
- Next Major Support: $105,500 (MA-99 & horizontal demand zone)
- Near-term Resistance: $110,500 (recent high), followed by psychological $112,000
4. Trend Structure
- Series of higher highs and higher lows since June 26 confirms short-term uptrend.
- Pullbacks remain shallow, indicating strong dip-buying interest.
5. Volume Analysis
- Volume has been consistent but not overly extended, suggesting sustained interest without overheated speculative inflows.
📈 24-Hour Short-Term Prediction (Bullish Scenario)
Forecasted Price Range (next 24h):
➡️ $109,800 – $111,500
Probability of Bullish Breakout: 78%
Key Drivers:
- Strong MACD support
- Short-term EMA compression with price holding above 100-period MA
- Momentum continuation after recent breakout past $108,000 resistance
📈 Mid-Term Outlook (3–5 Days)
Target Zone:
➡️ $112,500 – $115,000
Technical Argument:
- Potential Fibonacci extension from $102,000 low to $110,500 local high gives a 1.272 target ≈ $114,900
- MA cross system supports upward continuation unless a high-volume reversal breaks MA-21
🔐 Strategic Insights
- Long Entries near $108,400–$108,900 remain attractive
- Stop-loss recommendation for short-term trades: $106,900 (below MA-99 dynamic support)
- Momentum traders may look to break $110,500 as a trigger for push toward $112K+
🧠 Try the AI-based Chart Analyzer for Free!
The AI Chart Analyzer will soon switch to a paid model.
Current Basic Model → Planned price: $129.99/month
(Upcoming) Advanced Inference Model (based on TradingView chart backtesting) → Planned price: $599.99/month
Before it becomes paid, we are offering a lifetime free license to users who sign up through the links below and make their first deposit within the limited-time promotion period.
🔗 Bybit Fee Discount Link: http://bybitjoin.com
🔗 Binance Fee Discount Link: http://binancetrack.com
✔️ Up to $30,000 in trading event bonuses
✔️ Up to 45% trading fee discount + welcome bonuses
✔️ Exclusive benefits for early registrants before official launch of the paid AI model
📌 Important Notes
→ After switching to the paid model, the AI Chart Analyzer will remain permanently free for users who sign up through the above links and log in using their Bybit or Binance registered email addresses.
→ The upcoming advanced AI model is also designed to be accessed using those registered emails.