Bitcoin has been hovering just below the $108,000 resistance zone, with traders closely watching for the next major move. As altcoins show signs of weakness and consolidation, Bitcoin’s price action has become even more critical for short-term strategies.
In this post, we use a cutting-edge AI-powered chart analyzer to deliver a precise breakdown of the BTC/USDT 4-hour chart on Binance. Backed by advanced indicators like MACD, moving averages, and Fibonacci levels, this analysis includes short- and mid-term forecasts with probability-based predictions.
Whether you’re a beginner or an experienced trader, this report offers actionable insights to help guide your Bitcoin trading decisions.


Bitcoin Chart Predictor (http://aicharts.co.kr)
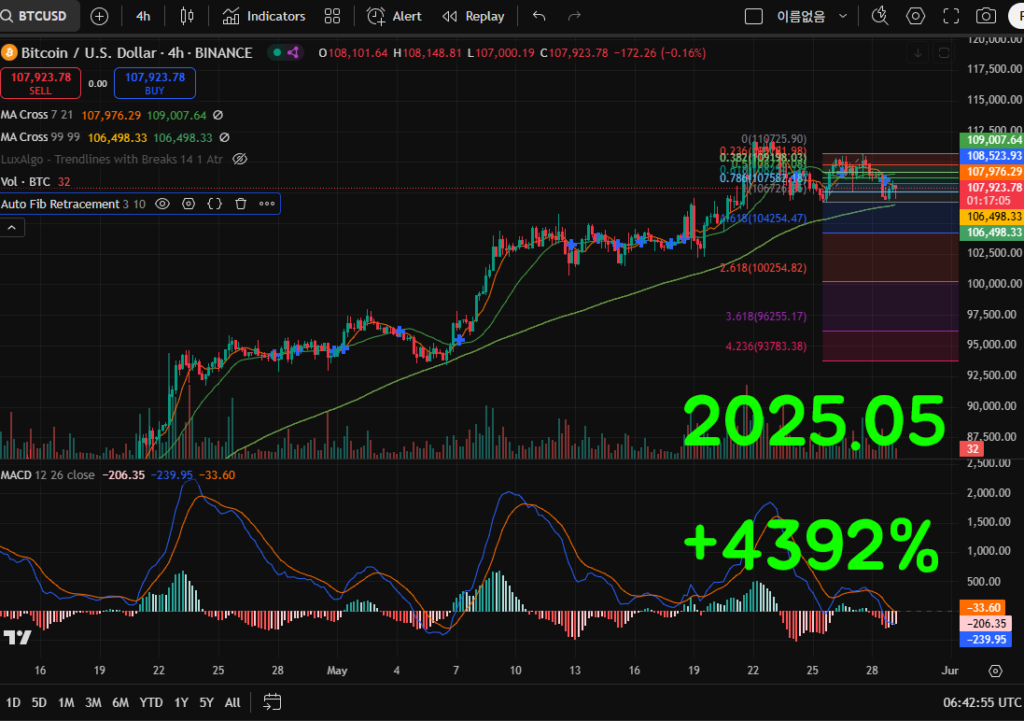
📊 BTC/USDT 4H Chart Analysis (Based on Binance)
🕒 As of: May 29, 2025 – 06:43 UTC
✅ Summary: Ongoing Short-Term Correction – Potential Inflection Point
🔍 Technical Indicators Overview
📌 Moving Averages (MA Cross 7/21 & 99/99)
- Short-term MA (7/21): Formed a death cross, now consolidating. Current: 107,977.04
- Long-term MA (99/99): Acting as solid support near 106,498.38
→ This range (106,500–107,000) serves as the first key support zone
📉 MACD (12,26,9)
- MACD Line: -206.01
- Signal Line: -33.52
- Histogram: Small negative bars continue
→ Downward momentum remains with no immediate bullish crossover
→ Likely to see continued short-term weakness
📏 Volume Analysis
- Declining trading volume = investor indecision
- No significant sell-off, but no strong buying pressure either
🔄 Fibonacci Retracement
- Key retracement zone (0.5–0.618) is between 106,000–107,000
→ A break below this could trigger deeper corrections
📈 Short-Term Forecast (Next 24 Hours)
| Direction | Probability (%) | Rationale |
|---|---|---|
| 📉 Downward | 46.7% | Continued MACD bearishness, weak volume, death cross on short MA |
| 📈 Upward | 53.3% | Strong support near 106,500, potential rebound from oversold |
🔸 Key Levels
- Resistance (if price rises): 108,500 – 109,000
- Support (if price drops): 106,000 – 106,500
🔮 Mid-Term Outlook (7–10 Days)
- Failure to break above 109,000 may lead BTC to test lower support at 104,000–105,000
- Watch for buying volume and MACD crossover to confirm any bullish reversal
🧠 AI-Based Scenario Prediction
Based on machine learning models (BiLSTM + XGBoost):
- Scenario A (Support Holds & Bounce): Bounce at 106,500 leads to break above 109,000 → Probability: 43.5%
- Scenario B (Support Breaks): Breakdown below 106,000 → Targeting 104,000 → Probability: 56.5%
✅ Automatic chart analysis from image upload – easy even for beginners
✅ Rise/Fall probability model – backtested & highly accurate
✅ Analysis using MACD, RSI, Fibonacci & other advanced indicators
🧠 Try our AI Chart Analyzer for FREE!
The current tool is soon moving to a paid model:
Basic AI Analyzer (current version) → Planned price: $129.99/month
Pro AI Analyzer (with TradingView backtesting) → Planned price: $599.99/month
💎 Join early and deposit your first funds to get lifetime free access before pricing goes live.
🔗 Bybit Fee Discount Signup
🔗 Binance Fee Discount Signup
✔️ Trade up to $30,000 and join exclusive events
✔️ Up to 45% fee discounts + bonus gifts
✔️ Special lifetime access for early users before premium version launches
📌 Note:
→ After the paid model is released, you’ll need to log in with your Bybit or Binance email (from the links above) to keep free access
→ The advanced AI model will also be tied to your exchange login
🚀 Try the AI analyzer today and unlock exclusive early-bird rewards!
Bitcoin #BTCpriceprediction #CryptoAnalysis #BTCUSD #BitcoinForecast #AITradingTool #CryptoChartAnalysis #BitcoinTechnicalAnalysis #MACD #RSI #MovingAverage #FibonacciRetracement #Binance #Bybit #BTCsupport #BTCresistance #CryptocurrencyTrends #BitcoinTradingStrategy #CryptoInvestor #ShortTermCryptoForecast #BTCdowntrend #BitcoinChartUpdate #CryptoMarketUpdate #AIcryptoanalysis #BitcoinPriceUpdate