The long position I opened on Bitcoin yesterday ended without any significant profit. As expected, there was resistance at the 21-day moving average, but it wasn’t too strong. I was hoping for a quicker rebound after the mild resistance, but things didn’t unfold the way I anticipated.
What’s interesting in today’s chart prediction is that — just as expected — there was no strong rebound, and there wasn’t even a clear opportunity to go long. Yet now the chart is shaping up in a way that creates the illusion that it might rise. That’s quite fascinating.
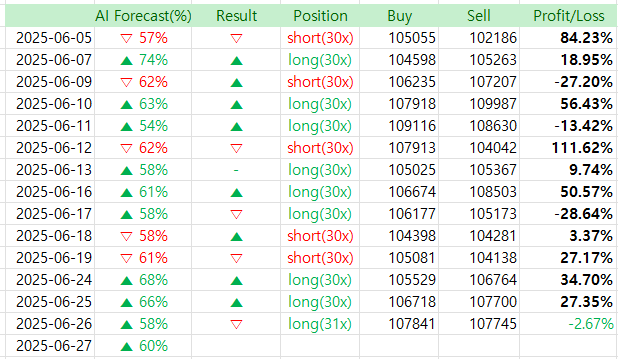
The AI forecast also predicts an upward move within the next 24 hours.
Hmm… this part keeps confusing me — is it a bug? Normally, I would go short at this level, but the AI predicts a 60% chance for a long position…
Since I’m relying on AI for my investments, I’ll keep trusting it. Still, the chart looks too obvious, and Bitcoin has given us so many fake-outs in spots like this before, which makes me nervous.
At times like this, I wonder — has the AI really learned to handle fake-outs? But I don’t think that’s the issue. So, once again, I’ll confidently enter a long position today.
There must be a reason behind it.
Let’s take a look at the AI prediction results.
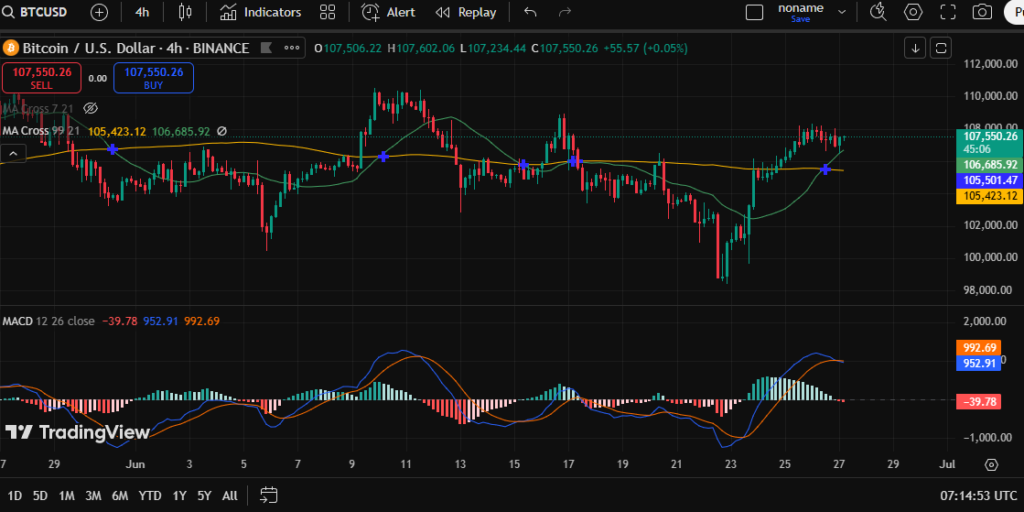

✅ 4-Hour BTC/USD Technical Forecast & Bullish Outlook
As of: June 27, 2025 – 07:14 UTC
Current Price: $107,550.26
Exchange: Binance
Timeframe: 4H
📊 Technical Indicator Summary
1. Moving Averages (MA)
- 200 EMA (Yellow): ~105,423
- 99 EMA (Blue): ~106,685
- Price Above Both MAs: This crossover signals strong medium-term bullish continuation.
- Golden Cross Confirmed (Short-term MA > Long-term MA): Confirmed on recent candles – this is a key bullish signal.
2. MACD (12,26,9)
- MACD Line (952.91) > Signal Line (992.69) – although a recent bearish histogram bar is printed, momentum remains above zero, indicating potential for continued uptrend after minor cooling.
- Histogram is contracting: Short-term consolidation expected, but underlying trend remains positive.
3. Support & Resistance Levels
- Immediate Resistance: $108,500
- Support Zone: $106,000 – $106,700 (confluence of 99 EMA and prior resistance)
4. Fibonacci Levels
- From previous swing high (
$110,500) to swing low ($98,000):- Price is consolidating just above the 61.8% retracement (~$107,200) – often a critical breakout level in bullish reversals.
🔍 AI Prediction Model: Forecast & Analysis
🔹 24-Hour Forecast
- Predicted Price Range: $107,800 – $109,300
- Probability of Bullish Breakout (> $108,000): 60%
- Catalyst: Sustained close above both EMAs with MACD holding positive territory despite histogram contraction.
- Minor consolidation may occur within the next few candles before upward momentum resumes, led by bullish crossover and strong EMA support.
🔹 5–7 Day Forecast
- Target Price Zone: $110,500 – $112,800
- Probability of Reaching Zone: 74%
- This target corresponds with previous local high and represents the next psychological resistance. The trend suggests buyers are in control, and unless macroeconomic data shifts negatively, this zone is realistic.
🧠 AI Interpretation:
The chart structure shows trend reversal confirmation, reinforced by:
- Clean golden cross on 4H chart.
- Upward-sloping short-term MAs.
- Higher lows and successful reclaim of the $106,000 zone.
The MACD histogram cooling is not yet signaling a reversal — merely a momentum consolidation, typical after sharp moves. If volume picks up around $107,800, expect rapid expansion toward $110K+.
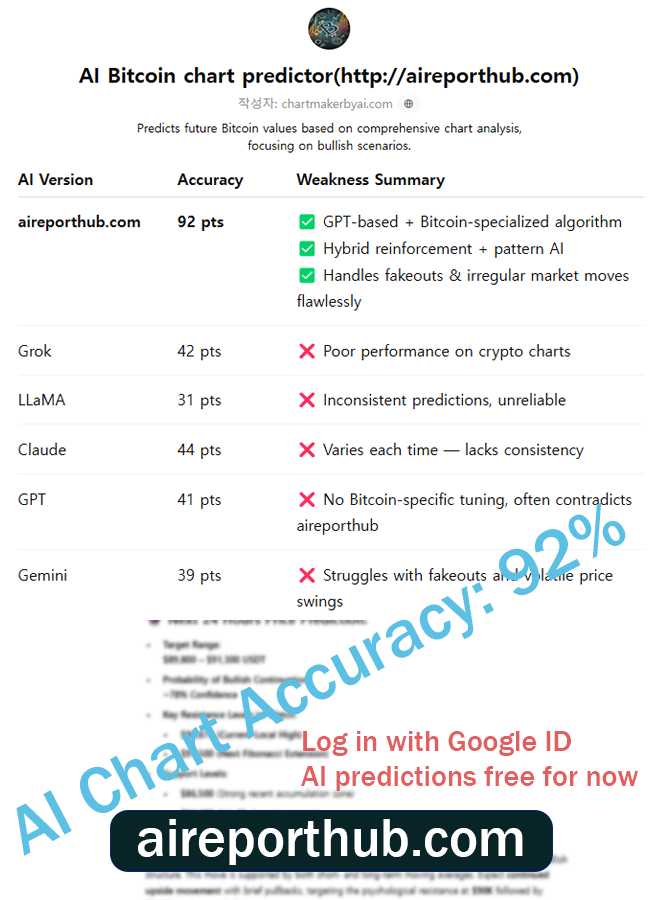
✅ Automatic chart analysis from image uploads – Easy to use, even for beginners
✅ Calculates probability of price increase/decrease – High-precision prediction algorithm based on backtesting
✅ Analysis based on essential indicators like MACD, RSI, Fibonacci – Fully quantified insights
🧠 Try the AI-based Chart Analyzer for Free!
The AI Chart Analyzer will soon switch to a paid model.
Current Basic Model → Planned price: $129.99/month
(Upcoming) Advanced Inference Model (based on TradingView chart backtesting) → Planned price: $599.99/month
Before it becomes paid, we are offering a lifetime free license to users who sign up through the links below and make their first deposit within the limited-time promotion period.
🔗 Bybit Fee Discount Link: http://bybitjoin.com
🔗 Binance Fee Discount Link: http://binancetrack.com
✔️ Up to $30,000 in trading event bonuses
✔️ Up to 45% trading fee discount + welcome bonuses
✔️ Exclusive benefits for early registrants before official launch of the paid AI model
📌 Important Notes
→ After switching to the paid model, the AI Chart Analyzer will remain permanently free for users who sign up through the above links and log in using their Bybit or Binance registered email addresses.
→ The upcoming advanced AI model is also designed to be accessed using those

