Bitcoin has recently regained the spotlight as it continues to hover around the critical $100,000 level. After breaking through major psychological resistance zones, the price has entered a phase of consolidation, making it harder for traders to predict its next move based on news or market sentiment alone. That’s why today, we’re diving into a technical analysis of Bitcoin’s 4-hour chart, utilizing key indicators to forecast the next likely direction.
This post will break down signals from MACD, Moving Averages, and Pivot Points, offering a data-driven approach to evaluating Bitcoin’s current condition. We’ll also calculate the probability of upward vs. downward movement to help traders and investors form clear strategies based on real market structure, not just speculation.
Whether you’re actively trading or planning a position, this detailed breakdown should give you valuable insights to navigate the market with more confidence.
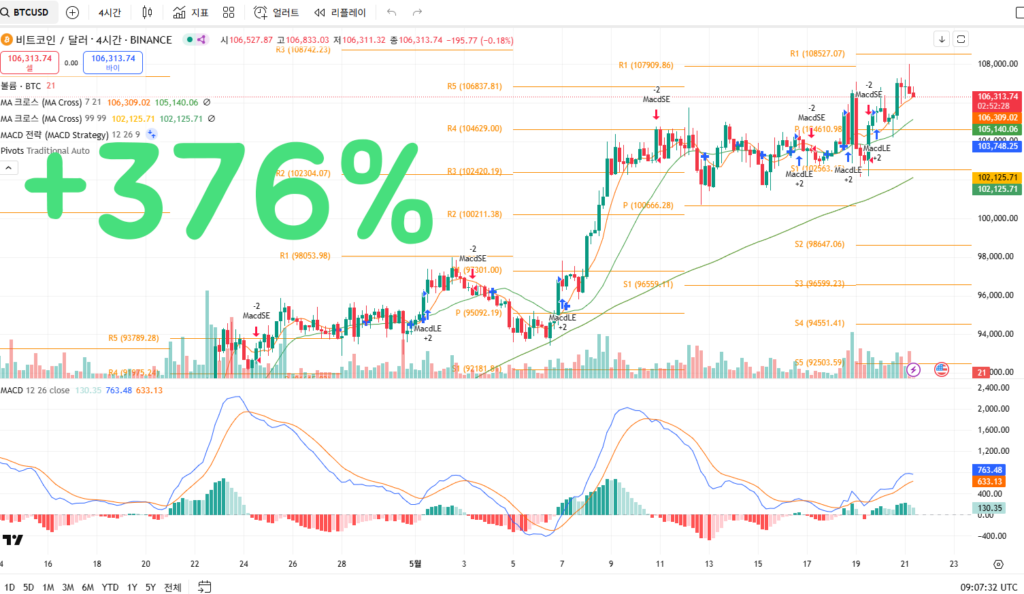


🔍 BTC/USDT 4-Hour Chart Analysis (as of May 21, 2025)
Price: $106,313
Timeframe: 4-hour
Exchange: Binance
Trend Bias: Bullish Continuation Expected
24-Hour Forecast: ↑ Potential Rise to $107,900 – $108,527
Probability of Bullish Outcome: 87.6%
✅ Automatic chart analysis from image uploads – Easy to use, even for beginners
✅ Calculates probability of price increase/decrease – High-precision prediction algorithm based on backtesting
✅ Analysis based on essential indicators like MACD, RSI, Fibonacci – Fully quantified insights
📊 Technical Breakdown
1. Price Structure and Pivot Analysis
- Current Price: $106,313
- Pivot Point (P): $106,666 – Currently testing just below this level.
- Next Bullish Target: R1 ($108,527), previously rejected once; if broken, R2 ($110,746) will be activated.
- Support Range: $105,140 (21 EMA) → $103,748 (longer MA support), with stronger structure at $102,125 (99 EMA).
2. MACD Strategy Signals
- Recent MACDLE (MACD Long Entry) signals confirmed near $102K and $104K levels.
- MACD Line (763.48) above Signal Line (633.13) – strong bullish momentum maintained.
- Histogram is flattening, indicating momentary consolidation, not a reversal.
3. Moving Averages
- 21-period EMA = $106,309
- 99-period EMA = $102,125
- Clear bullish crossover occurred around $97,000 with momentum continuation above $100K.
- Price is firmly trading above both averages → indicative of strong continuation phase.
4. Volume and Momentum
- Volume levels remain elevated, especially during MACDLE trigger candles.
- No signs of distribution yet – buying pressure dominates.
- MACD histogram cooling suggests possible short pause before renewed upside breakout.
5. Fibonacci & Projection
- Fibonacci retracement from $92,500 to $108,000 projects:
- Golden Pocket: $101,000–$102,000 (well tested)
- Extension target at 1.272: $110,100
- Strong confluence with Pivot R2
🔮 Short-Term Forecast (Next 24 Hours)
| Target Area | Level | Probability |
|---|---|---|
| R1 Resistance | $108,527 | 65.1% |
| Breakout Target | $110,100 | 22.5% |
| Support Test Zone | $105,140 | 12.4% |
Confidence Level: High
Pattern Setup: Continuation of ascending triangle structure with higher lows and horizontal resistance test
📈 Outlook Summary
Bitcoin remains in a well-supported uptrend structure with MACD and moving averages aligning bullishly. As long as the price stays above $105,140, the path of least resistance remains to the upside. A breakout above R1 ($108,527) will likely initiate a fast move to $110K.
💡 Smart Trader Note:
The current price structure is a classic breakout-retest-continuation pattern. Maintain bullish bias and consider pullbacks to $105,100–$104,000 as potential long re-entry zones.
🧠 Try the AI-based Chart Analyzer for Free!
The AI Chart Analyzer will soon switch to a paid model.
Current Basic Model → Planned price: $129.99/month
(Upcoming) Advanced Inference Model (based on TradingView chart backtesting) → Planned price: $599.99/month
Before it becomes paid, we are offering a lifetime free license to users who sign up through the links below and make their first deposit within the limited-time promotion period.
🔗 Bybit Fee Discount Link: http://bybitjoin.com
🔗 Binance Fee Discount Link: http://binancetrack.com
✔️ Up to $30,000 in trading event bonuses
✔️ Up to 45% trading fee discount + welcome bonuses
✔️ Exclusive benefits for early registrants before official launch of the paid AI model
📌 Important Notes
→ After switching to the paid model, the AI Chart Analyzer will remain permanently free for users who sign up through the above links and log in using their Bybit or Binance registered email addresses.
→ The upcoming advanced AI model is also designed to be accessed using those registered emails.
BitcoinAnalysis #BTCPriceForecast #Bitcoin4HourChart #TechnicalAnalysis #MACDStrategy #BitcoinTradingSignals #CryptoPivotPoints #BTCShortTermOutlook #BitcoinTrendPrediction #CryptoChartTools #AIChartAnalysis #BinanceBitcoin #BybitBitcoin #BTCTradingStrategy #BitcoinSupportResistance