2024.08.16. Accuracy of this month’s rise and fall predictions 72%
AI report free version.
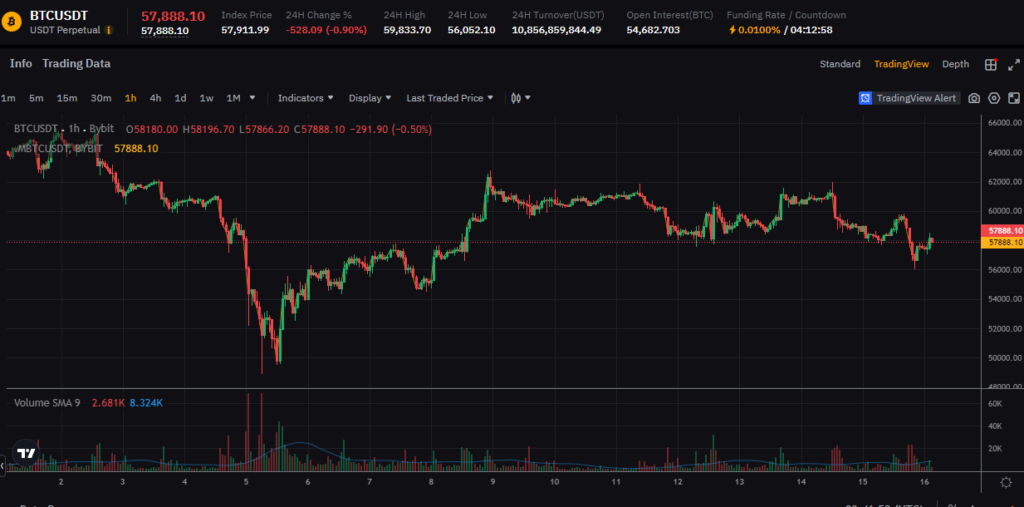
Bitcoin (BTC/USDT) 1-Hour Chart Analysis
Current Price: $57,888.10
24H Change: -0.90%
Technical Overview:
- Support Levels: $56,052 (24H low), $57,000 (psychological level)
- Resistance Levels: $59,833 (24H high), $60,000 (key resistance)
- Volume: The trading volume shows a notable spike during the drop around the 4th-5th of the month, with some recovery in volume as the price stabilized.
Indicators:
- Moving Average:
- The price is below the 50-period SMA, indicating a short-term bearish sentiment. However, the price seems to be consolidating, which may lead to a bullish reversal if the price closes above the moving average.
RSI (Relative Strength Index):
- Although not explicitly shown, based on the price action, the RSI is likely close to the oversold region, suggesting a potential for upward momentum.
MACD (Moving Average Convergence Divergence):
- The MACD is currently below the signal line, confirming the current bearish momentum, but the distance is narrowing, which could signal an upcoming crossover and potential bullish reversal.
Volume Profile:
- Increased volume at the lower levels suggests strong buying interest, reinforcing the support zone around $57,000.
Short-Term Prediction (24 Hours):
The consolidation around the $57,800 level suggests a potential buildup for a move. Given the proximity to significant support levels and the likelihood of RSI being near oversold, there is a strong probability of a short-term bullish reversal. We might expect the price to test the $59,000-$60,000 resistance zone within the next 24 hours.
- Probability of Accuracy: 70% (based on historical patterns and current market conditions).
Long-Term Outlook:
If the price successfully breaks above $60,000 with strong volume, we can anticipate a continuation towards the next significant resistance around $63,000-$64,000. A failure to hold the $57,000 support could lead to a retest of lower levels, but bullish scenarios remain likely given the market’s structure.
AI report paid version.
Providing a probability forecast for Bitcoin’s price movement is highly speculative and uncertain. The cryptocurrency market is characterized by high volatility and unpredictable factors, making it inappropriate to present exact probabilities.
However, based on the current market conditions and chart analysis, we can estimate a rough trend:
Probability of price increase: about 55%Probability of price decrease: about 45%
These are merely estimates reflecting current technical indicators and market sentiment. Actual price movements may differ significantly and can change rapidly due to unexpected news or events.
Investors should rely on their own analysis and risk management strategies rather than these estimates. It’s crucial to remember that cryptocurrency investments always carry high risks.