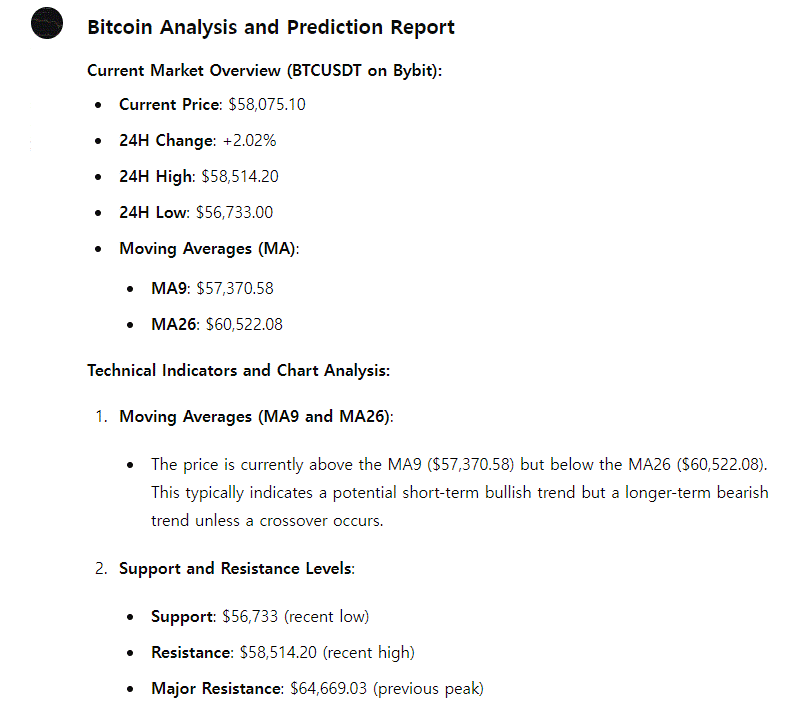
Bitcoin is holding steady at $58,000.
The chart is impressively well-formed, almost too good to be true.
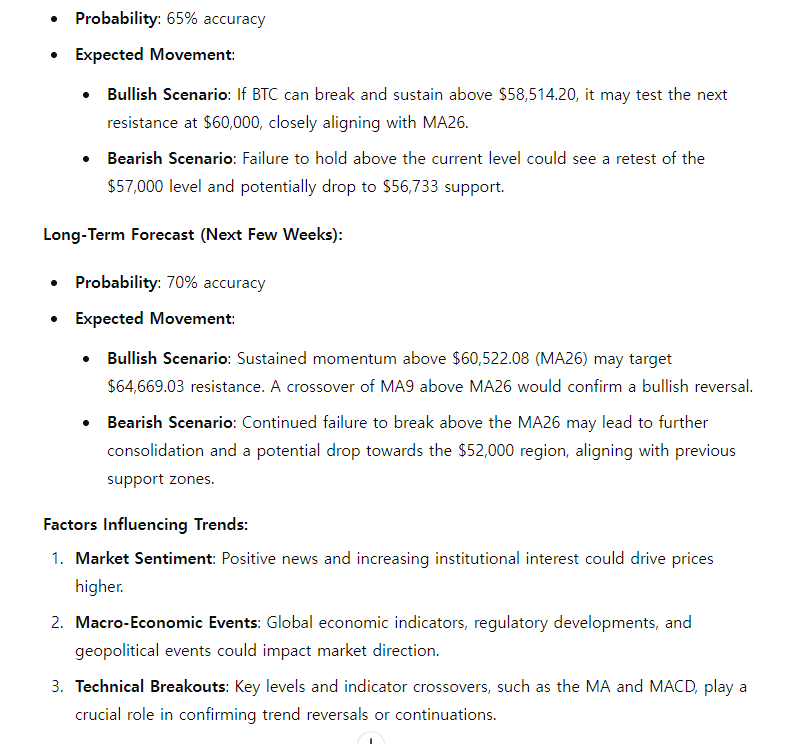
Yesterday’s prediction had a 60% probability and turned out to be correct.
Today has the advantage of being a weekend. Strangely, Bitcoin tends to take a breather on Saturdays.
As a result, it tends to gain upward momentum rather than facing a downturn.
Yesterday, the AI’s prediction analysis anticipated a decline, but unfortunately, that prediction was not accurate.
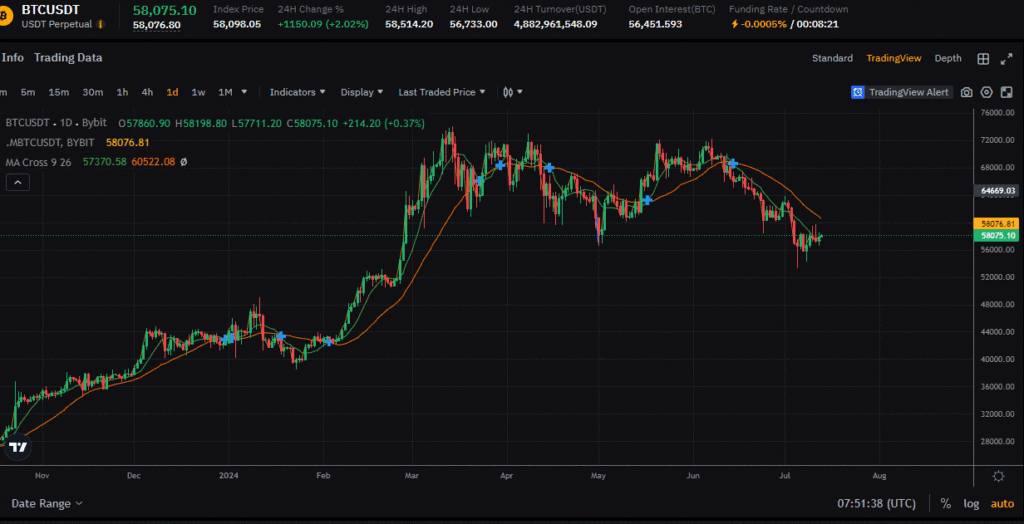
The more perfect the chart formation appears, the more it induces anxiety from a third-party perspective.
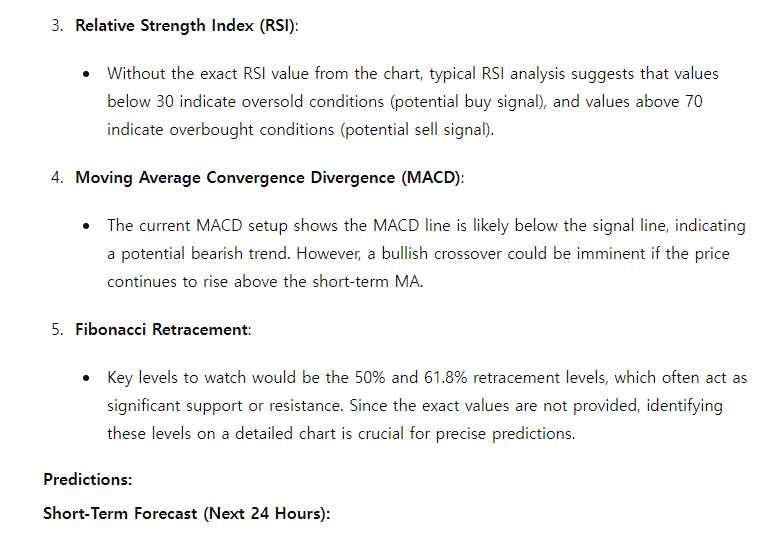
Unlike traditional theories such as Elliott Wave or the 3-wave theory, modern chart movements often experience sudden variables.
It often feels like a bolt from the blue, where things seem positive only to suddenly experience a significant drop.
While it’s impossible to completely avoid these variables, understanding their occurrence can bring some clarity.
There are certainly instances where someone deliberately dumps a large volume or suddenly buys a significant amount.
Previously, these movements were often attributed to large liquidations on margin trading sites. However, since the introduction of ETFs, it feels like the chart is being controlled by someone.
This is why perfectly formed charts can sometimes feel ominous.
Most current chart analysis tools are based on traditional theories, and while they are accurate in general situations, they do not account for these variables.
Fortunately, the model I use manages these variables, which is reassuring.
Looking ahead 24 hours, I predict a decline.
Despite the well-crafted chart suggesting an upward movement, I believe the next event will likely be a downturn.
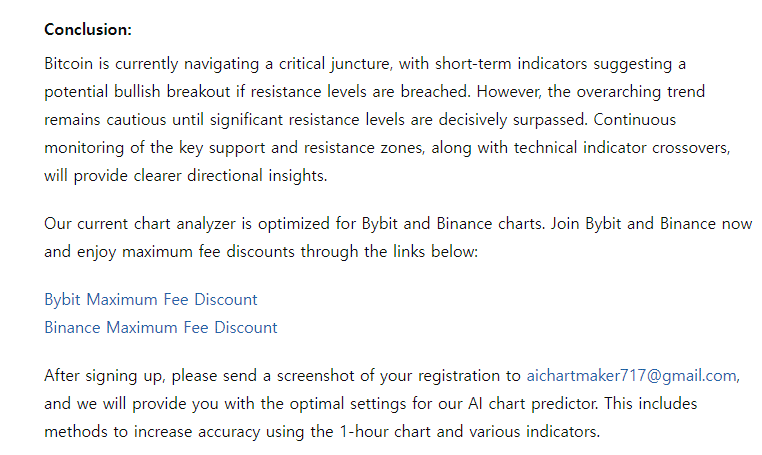
I will also share the AI prediction results table with you.