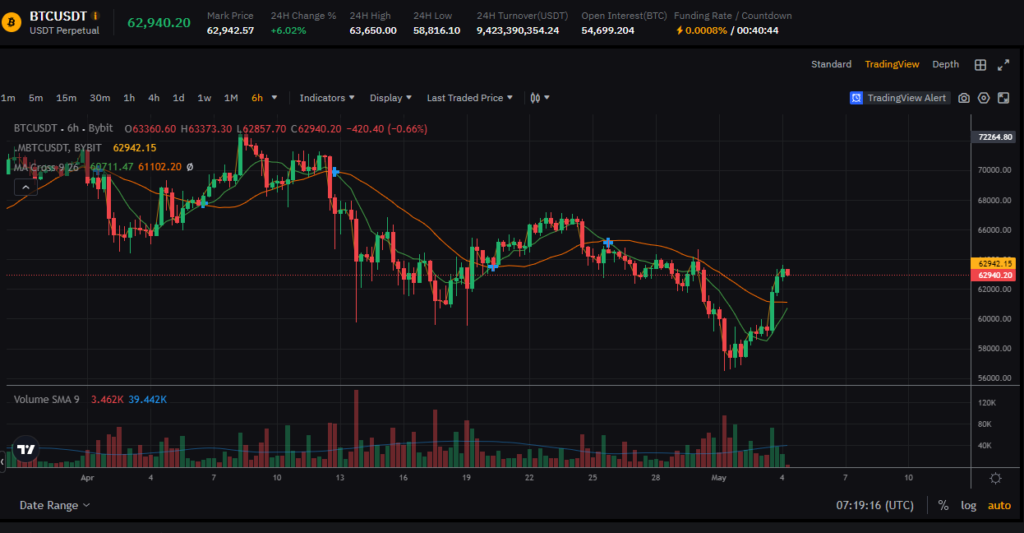
Bitcoin has risen.
It climbed from $59,000 to $63,000.
It rose more than expected and broke through the MA short-term line on a daily chart basis.
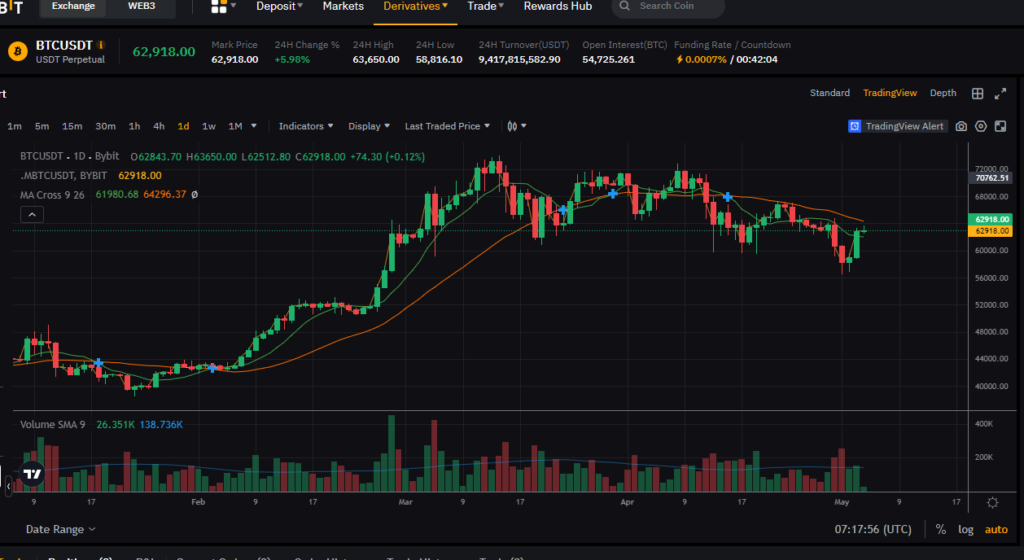
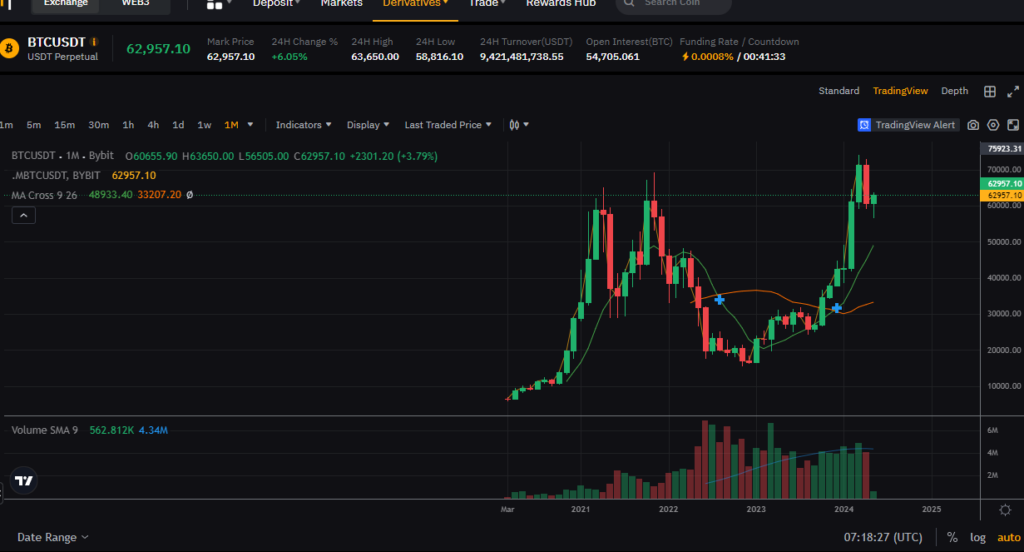
At the beginning of the month, monthly candles are drawn, which typically show high volatility, but I didn’t expect it to gently touch the upper levels like this.
However, since the $64,000 resistance line is strong, I think there is not much room for further increase.
I had predicted that it would continue to move sideways at the $56,000 support line and then fall, but contrary to expectations, it rose back up to the $64,000 resistance line.
With this development, the market is likely to predict another rise in Bitcoin, and it seems natural that a positive dominance theory would emerge.
However, I still foresee a decline in Bitcoin.
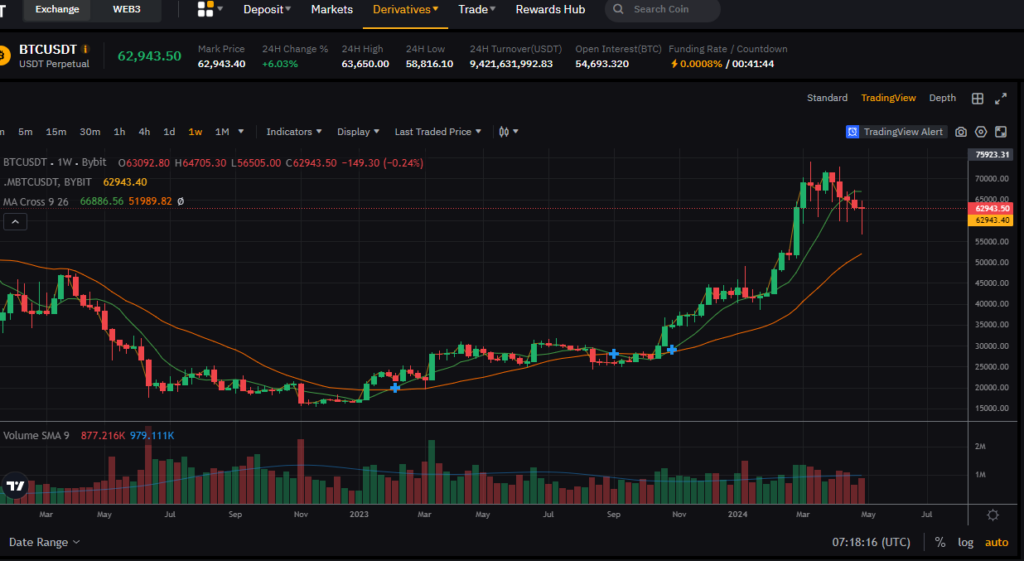
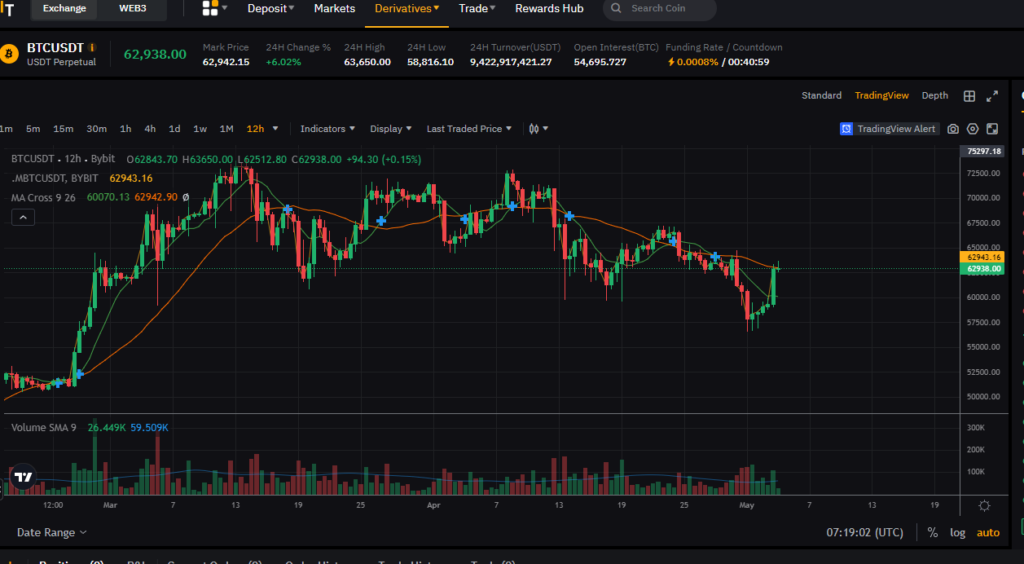
The broken chart is on a weekly basis, and it is not easy to recover on a daily or 12-hour chart once the weekly chart is broken.
Although it’s a game of probabilities, I still maintain this view because it seems right to bet on the higher probability.
Given the current shape and movement of the Bitcoin chart, which is typical for early May, moving back and forth, it seems good to keep an eye on it. It might also be a good opportunity for those doing margin trading to take some short positions now.
After all, it has reached the resistance line.
At support and resistance lines, it is always good to accompany partial profits and stops. Taking 1/3 or 1/2 partial profits or stops is the best strategy.
Anyway, I predict a decline in the graph movement after 24 hours. I feel good because it seems I can watch a bit more comfortably.
On the other hand, I also notice a trend where movements including both rises and falls have become stronger, rather than the one-way flow as before.