Trump is shaking up Bitcoin. Every word he utters sends Bitcoin prices fluctuating.
It has always been advised to be cautious of the movements of big whales when trading Bitcoin. However, Trump’s influence is so immense that it feels like he himself has become a whale and a force in the market.
The chart movements, breaking away from regular patterns, appear in unique forms, and everyone is keenly watching his words.
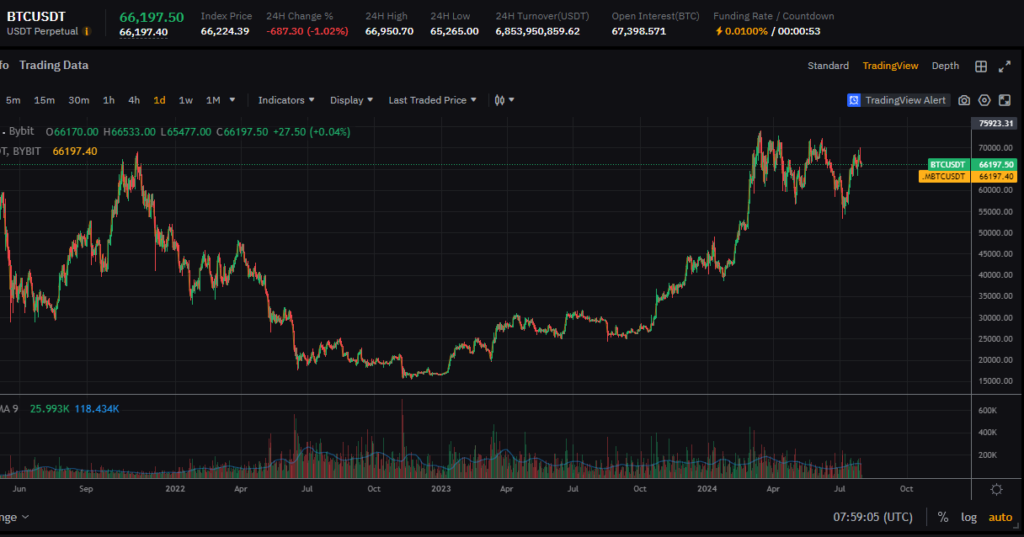
When Bitcoin prices crash, they usually plummet endlessly, but this time, it has touched its peak three times.
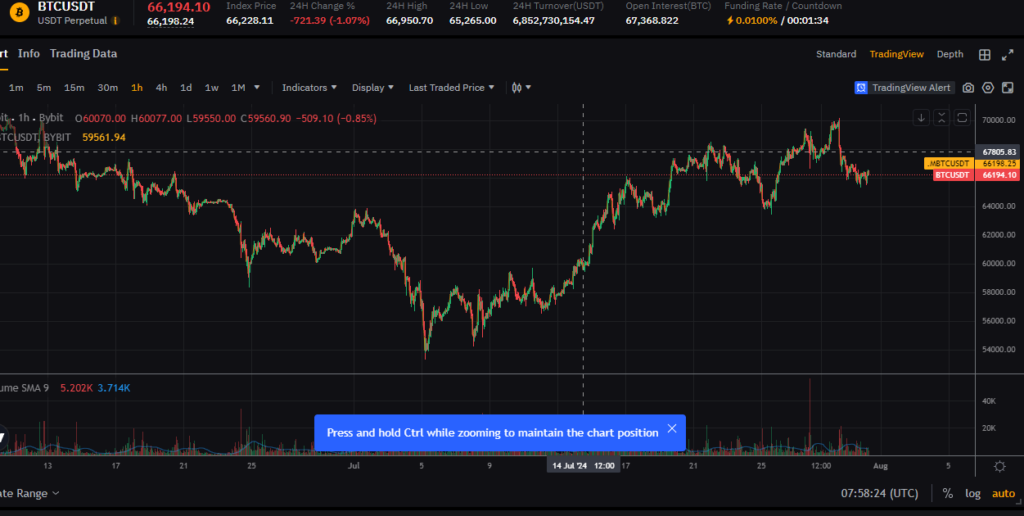
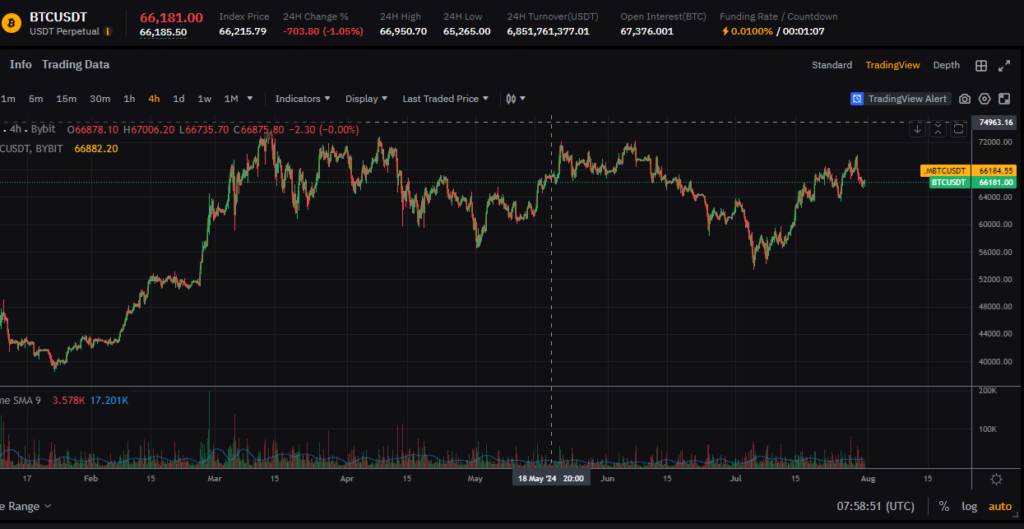
This unprecedented demand support is both terrifying and intriguing. However, it cannot be viewed entirely optimistically as another force seems to be guarding the $70,000 line. Based on the chart shapes and graph patterns, it should have surpassed $70,000 and continued to rise, but strangely, it drops whenever it hits $70,000.
Before major issues arise, it’s uncertain how the shape will develop, making Bitcoin predictions increasingly difficult. People usually predict a decline in such times.
The chart shapes suggest the same, and it’s hard to expect Trump to take any particularly special actions next.
But today is July 31, making the final chart shape crucial as it can indicate how the next month will proceed.
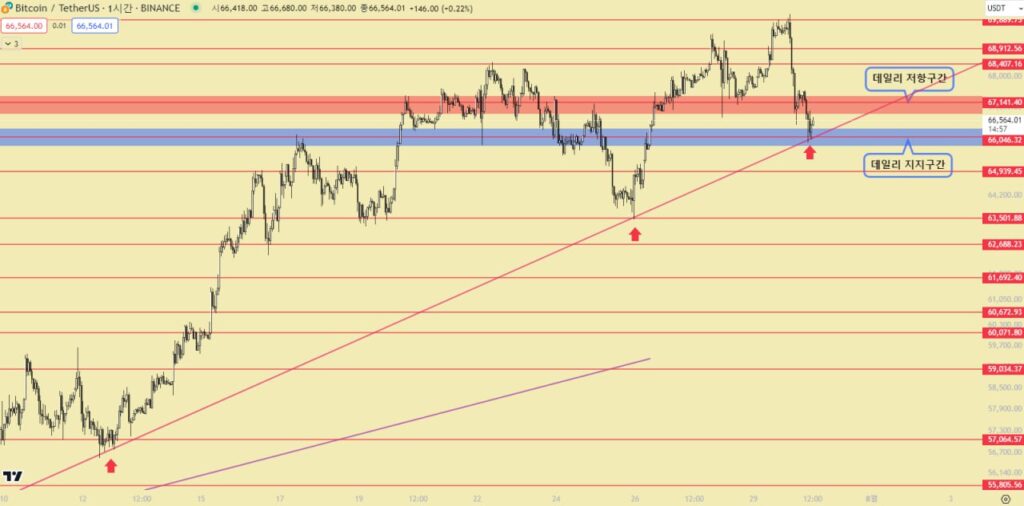
If it closes at $66,000, the monthly chart will form a shape with long upper and lower shadows, indicating a lot of indecision. This shape often results in a reversal when formed during a downtrend and can also indicate a reversal during an uptrend.
However, this time it has formed during a sideways movement, rendering it meaningless.
It’s advantageous not to trade at the end of the month, the end of the week, etc., so it’s best to take a break today.
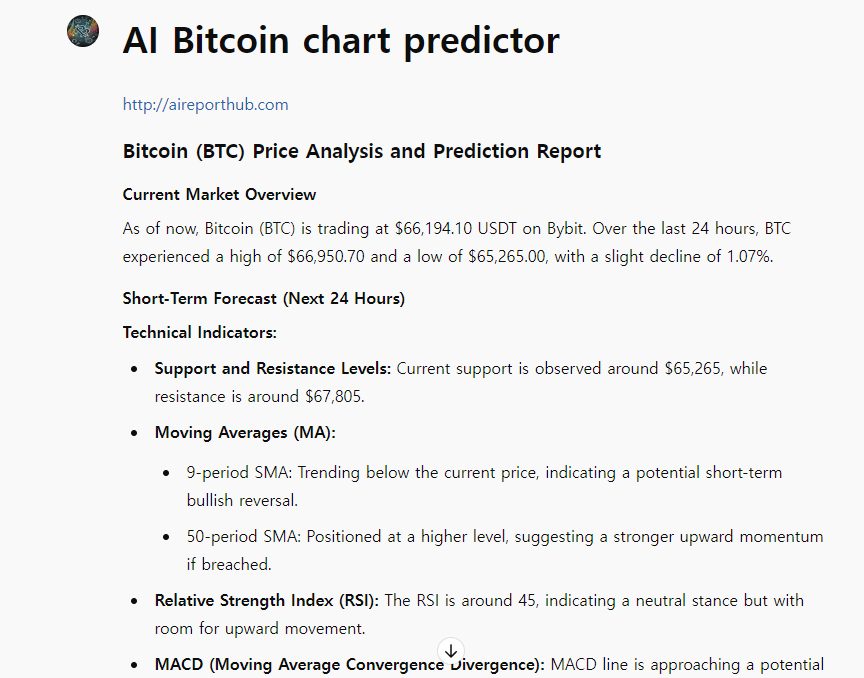
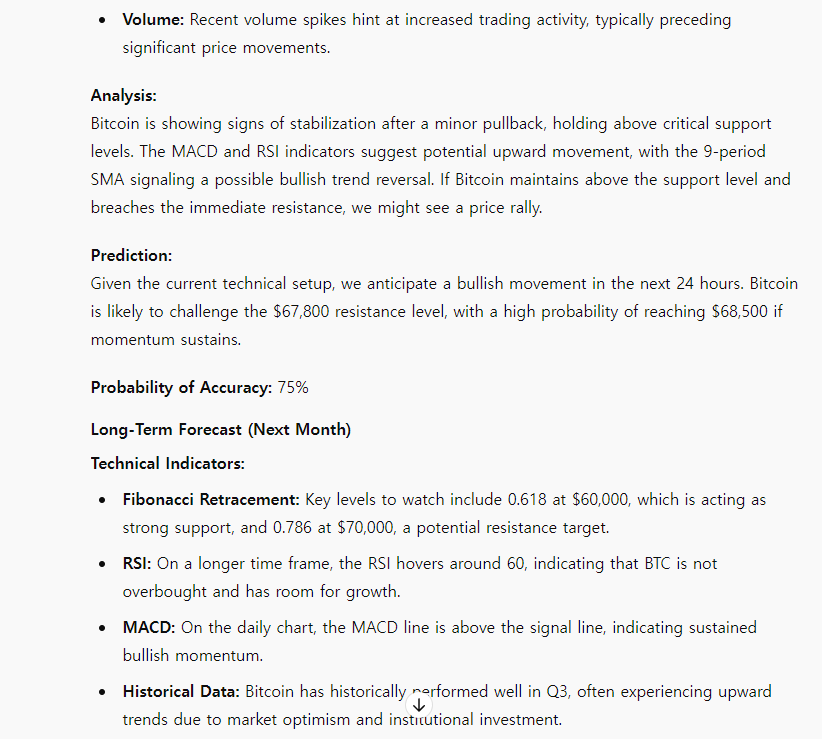
I will also attach the AI chart report.