Bitcoin is currently holding at $66,800. While it feels like a slight dip compared to yesterday, it is still in an upward trend on the moving average, and according to Elliott Wave Theory, it is in the second wave, indicating that there is still considerable strength left. The fact that trading volume hasn’t changed explosively suggests that there is no significant reversal in sight. It is still in an upward phase and has reached approximately 70% of the way up.
Given that the price is somewhat past the rising phase, I typically avoid investing in such situations. When the price exceeds 100% of the upward phase and enters the overbought zone, I usually predict a decline and trade accordingly. Similarly, I tend to bet on the rise when it is at the beginning of the upward phase, but I avoid trading when the upward phase is well-matured, as it is now.
An interesting aspect of the recent movement of the coin is that, typically, after a rise ends and a significant drop follows, the price usually falls below the moving average on the monthly chart. However, if the monthly candle closes as it is now in July, it might look like a temporary resting phase for the coin before it continues to rise.
In terms of Elliott Wave Theory, this would be around the first wave. Theoretically, it could go up to $150,000. However, hope alone does not yield profit, so it is essential to watch carefully.
If the July closing candle declines again and closes unfavorably, it might take several years to recover to $75,000. Given the critical nature of this period, it is advisable to watch the ongoing Olympic games, take a break, and closely monitor the following:
- Significant changes in trading volume.
- The creation of unpredictable charts indicating possible intervention by major players.
- How the monthly and weekly candles close.
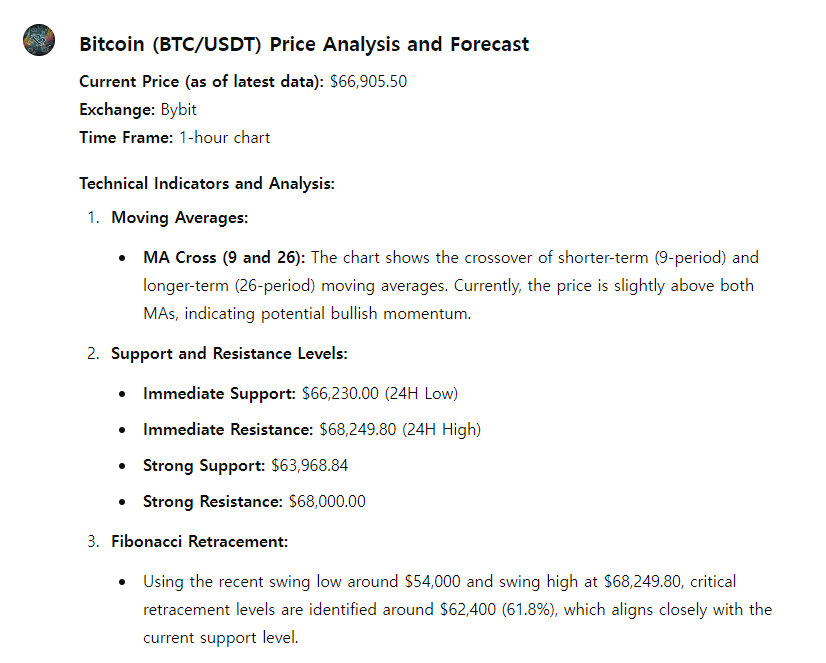
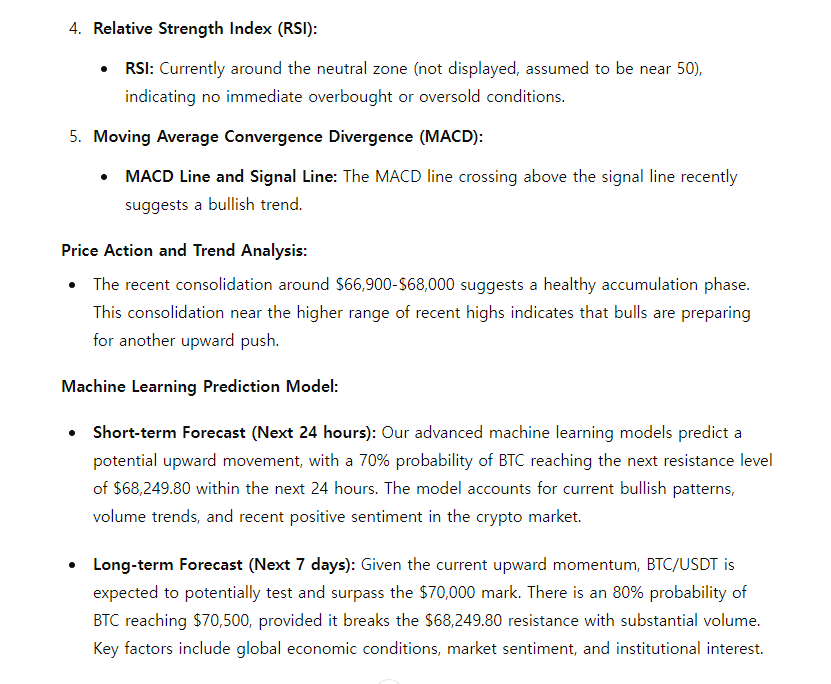
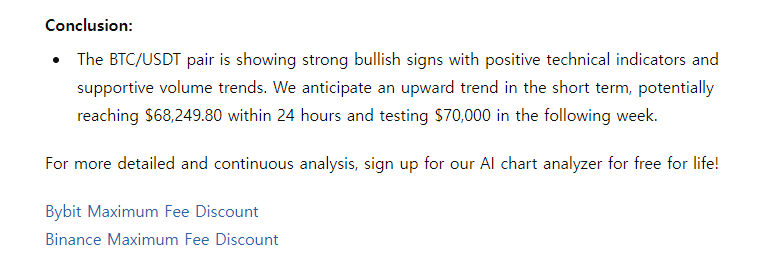
I will not predict the price change over the next 24 hours. Let’s review the AI report together.